Sbisensex 535276 full analysis,charts,indicators,moving averages,SMA,DMA,EMA,ADX,MACD,RSISbisensex 535276 WideScreen charts, DMA,SMA,EMA technical analysis, forecast prediction, by indicators ADX,MACD,RSI,CCI BSE stock exchange
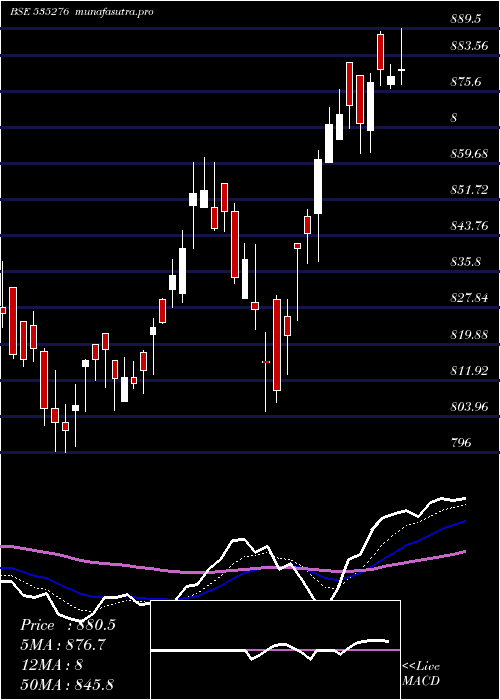
Daily price and charts and targets Sbisensex Strong Daily Stock price targets for Sbisensex 535276 are 933.33 and 948.88 | Daily Target 1 | 921.85 | | Daily Target 2 | 929.25 | | Daily Target 3 | 937.4 | | Daily Target 4 | 944.8 | | Daily Target 5 | 952.95 |
Daily price and volume Sbisensex
| Date |
Closing |
Open |
Range |
Volume |
Thu 23 October 2025 |
936.65 (0.43%) |
936.00 |
930.00 - 945.55 |
1.2107 times |
Tue 21 October 2025 |
932.61 (0.05%) |
935.00 |
931.66 - 939.31 |
0.1908 times |
Mon 20 October 2025 |
932.19 (0.62%) |
926.42 |
926.42 - 936.06 |
0.236 times |
Fri 17 October 2025 |
926.42 (0.24%) |
915.01 |
915.01 - 929.00 |
0.1804 times |
Thu 16 October 2025 |
924.22 (1.09%) |
908.10 |
908.10 - 925.00 |
1.1744 times |
Wed 15 October 2025 |
914.22 (0.49%) |
909.85 |
904.96 - 915.43 |
1.6505 times |
Tue 14 October 2025 |
909.79 (-0.16%) |
916.22 |
905.00 - 917.95 |
1.2791 times |
Mon 13 October 2025 |
911.21 (-0.34%) |
918.90 |
903.72 - 918.90 |
1.2469 times |
Fri 10 October 2025 |
914.33 (0.53%) |
910.66 |
906.00 - 915.00 |
1.5581 times |
Thu 09 October 2025 |
909.55 (0.44%) |
906.00 |
900.02 - 910.00 |
1.2732 times |
Wed 08 October 2025 |
905.60 (-0.15%) |
900.02 |
900.02 - 910.00 |
0.0901 times |
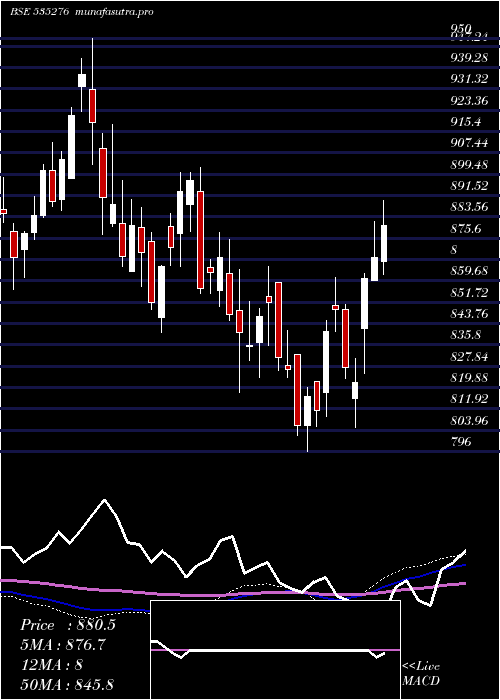
Weekly price and charts Sbisensex Strong weekly Stock price targets for Sbisensex 535276 are 931.54 and 950.67 | Weekly Target 1 | 917.08 | | Weekly Target 2 | 926.86 | | Weekly Target 3 | 936.20666666667 | | Weekly Target 4 | 945.99 | | Weekly Target 5 | 955.34 |
Weekly price and volumes for Sbisensex
| Date |
Closing |
Open |
Range |
Volume |
Thu 23 October 2025 |
936.65 (1.1%) |
926.42 |
926.42 - 945.55 |
0.6331 times |
Fri 17 October 2025 |
926.42 (1.32%) |
918.90 |
903.72 - 929.00 |
2.1387 times |
Fri 10 October 2025 |
914.33 (1.87%) |
887.02 |
887.02 - 915.00 |
1.7399 times |
Fri 03 October 2025 |
897.54 (0.54%) |
898.50 |
886.16 - 902.80 |
0.8145 times |
Fri 26 September 2025 |
892.74 (-2.37%) |
916.98 |
889.92 - 916.98 |
2.1546 times |
Fri 19 September 2025 |
914.40 (0.92%) |
916.57 |
900.30 - 922.13 |
0.2133 times |
Fri 12 September 2025 |
906.06 (1.64%) |
893.92 |
888.21 - 908.90 |
0.5052 times |
Fri 05 September 2025 |
891.42 (0.92%) |
889.98 |
880.02 - 899.96 |
0.8028 times |
Fri 29 August 2025 |
883.26 (-1.85%) |
895.02 |
882.92 - 907.90 |
0.7588 times |
Fri 22 August 2025 |
899.88 (0.97%) |
893.02 |
892.35 - 911.90 |
0.2392 times |
Thu 14 August 2025 |
891.21 (0.93%) |
888.00 |
875.10 - 896.00 |
0.3803 times |
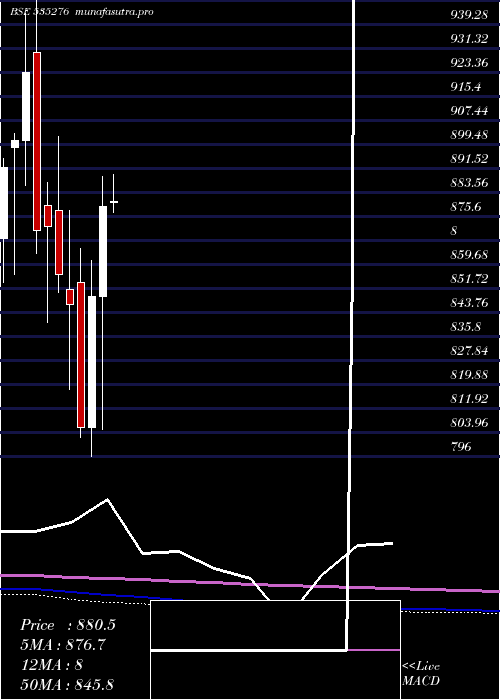
Monthly price and charts Sbisensex Strong monthly Stock price targets for Sbisensex 535276 are 911.83 and 970.38 | Monthly Target 1 | 864.52 | | Monthly Target 2 | 900.58 | | Monthly Target 3 | 923.06666666667 | | Monthly Target 4 | 959.13 | | Monthly Target 5 | 981.62 |
Monthly price and volumes Sbisensex
| Date |
Closing |
Open |
Range |
Volume |
Thu 23 October 2025 |
936.65 (5.43%) |
891.90 |
887.00 - 945.55 |
1.5991 times |
Tue 30 September 2025 |
888.40 (0.58%) |
889.98 |
880.02 - 922.13 |
1.4699 times |
Fri 29 August 2025 |
883.26 (-1.72%) |
900.00 |
875.10 - 911.90 |
0.6263 times |
Thu 31 July 2025 |
898.68 (-2.6%) |
929.98 |
885.63 - 929.98 |
0.5302 times |
Mon 30 June 2025 |
922.65 (2.99%) |
890.30 |
883.02 - 934.98 |
0.717 times |
Fri 30 May 2025 |
895.83 (1.94%) |
880.23 |
860.02 - 909.30 |
0.9877 times |
Wed 30 April 2025 |
878.81 (3.51%) |
849.00 |
805.00 - 888.90 |
1.0834 times |
Fri 28 March 2025 |
849.04 (5.38%) |
805.66 |
796.00 - 861.00 |
0.8985 times |
Fri 28 February 2025 |
805.66 (-4.8%) |
853.80 |
802.08 - 865.00 |
0.7486 times |
Fri 31 January 2025 |
846.26 (-1.19%) |
851.30 |
818.00 - 877.58 |
1.3393 times |
Tue 31 December 2024 |
856.42 (-1.81%) |
877.50 |
850.15 - 901.95 |
1.8116 times |
DMA SMA EMA moving averages of Sbisensex 535276
DMA (daily moving average) of Sbisensex 535276
| DMA period | DMA value | | 5 day DMA | 930.42 | | 12 day DMA | 918.64 | | 20 day DMA | 910.07 | | 35 day DMA | 906.91 | | 50 day DMA | 903.03 | | 100 day DMA | 903.76 | | 150 day DMA | 889.42 | | 200 day DMA | 877.08 | EMA (exponential moving average) of Sbisensex 535276
| EMA period | EMA current | EMA prev | EMA prev2 | | 5 day EMA | 929.88 | 926.5 | 923.44 | | 12 day EMA | 921 | 918.15 | 915.52 | | 20 day EMA | 915.39 | 913.15 | 911.1 | | 35 day EMA | 908.82 | 907.18 | 905.68 | | 50 day EMA | 904.75 | 903.45 | 902.26 |
SMA (simple moving average) of Sbisensex 535276
| SMA period | SMA current | SMA prev | SMA prev2 | | 5 day SMA | 930.42 | 925.93 | 921.37 | | 12 day SMA | 918.64 | 915.79 | 912.87 | | 20 day SMA | 910.07 | 908.66 | 907.36 | | 35 day SMA | 906.91 | 905.51 | 904.24 | | 50 day SMA | 903.03 | 901.96 | 901.12 | | 100 day SMA | 903.76 | 903.36 | 902.94 | | 150 day SMA | 889.42 | 888.61 | 887.77 | | 200 day SMA | 877.08 | 876.7 | 876.34 |
|
|
