Nibe 535136 full analysis,charts,indicators,moving averages,SMA,DMA,EMA,ADX,MACD,RSINibe 535136 WideScreen charts, DMA,SMA,EMA technical analysis, forecast prediction, by indicators ADX,MACD,RSI,CCI BSE stock exchange
Daily price and charts and targets Nibe Strong Daily Stock price targets for Nibe 535136 are 1318.23 and 1340.88 | Daily Target 1 | 1313.7 | | Daily Target 2 | 1322.75 | | Daily Target 3 | 1336.35 | | Daily Target 4 | 1345.4 | | Daily Target 5 | 1359 |
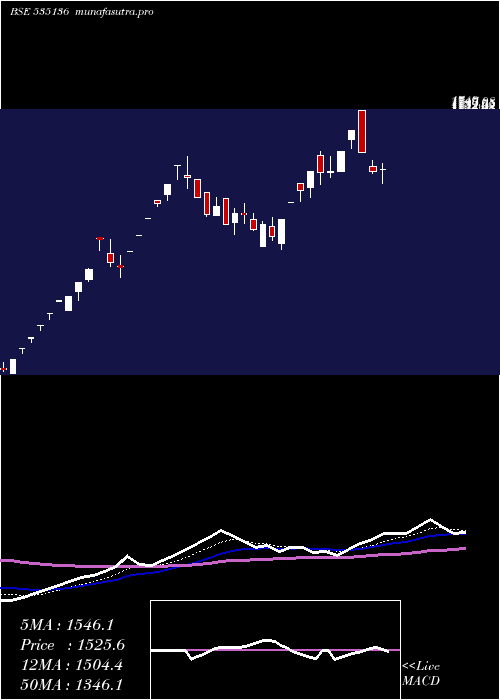
Daily price and volume Nibe
| Date |
Closing |
Open |
Range |
Volume |
Tue 21 October 2025 |
1331.80 (0.31%) |
1349.95 |
1327.30 - 1349.95 |
0.1544 times |
Mon 20 October 2025 |
1327.75 (0.39%) |
1330.00 |
1305.20 - 1335.00 |
0.6077 times |
Fri 17 October 2025 |
1322.65 (-0.8%) |
1389.90 |
1307.65 - 1389.90 |
0.5075 times |
Thu 16 October 2025 |
1333.30 (1.86%) |
1313.00 |
1313.00 - 1340.00 |
0.5948 times |
Wed 15 October 2025 |
1309.00 (3%) |
1265.35 |
1265.35 - 1332.40 |
0.7504 times |
Tue 14 October 2025 |
1270.85 (-2.03%) |
1301.05 |
1265.00 - 1326.85 |
1.1268 times |
Mon 13 October 2025 |
1297.15 (-3.09%) |
1343.80 |
1289.85 - 1343.80 |
0.7658 times |
Fri 10 October 2025 |
1338.55 (0.73%) |
1340.05 |
1326.55 - 1351.60 |
0.4007 times |
Thu 09 October 2025 |
1328.80 (-3.82%) |
1401.00 |
1312.55 - 1401.00 |
3.491 times |
Wed 08 October 2025 |
1381.60 (-1.21%) |
1419.95 |
1379.60 - 1419.95 |
1.6009 times |
Tue 07 October 2025 |
1398.50 (-1.3%) |
1422.30 |
1382.00 - 1441.15 |
0.8835 times |
Weekly price and charts Nibe Strong weekly Stock price targets for Nibe 535136 are 1318.5 and 1363.25 | Weekly Target 1 | 1284.23 | | Weekly Target 2 | 1308.02 | | Weekly Target 3 | 1328.9833333333 | | Weekly Target 4 | 1352.77 | | Weekly Target 5 | 1373.73 |
Weekly price and volumes for Nibe
| Date |
Closing |
Open |
Range |
Volume |
Tue 21 October 2025 |
1331.80 (0.69%) |
1330.00 |
1305.20 - 1349.95 |
0.0623 times |
Fri 17 October 2025 |
1322.65 (-1.19%) |
1343.80 |
1265.00 - 1389.90 |
0.3062 times |
Fri 10 October 2025 |
1338.55 (-8.57%) |
1499.95 |
1312.55 - 1499.95 |
0.6591 times |
Fri 03 October 2025 |
1463.95 (6.43%) |
1407.95 |
1384.25 - 1524.00 |
1.0862 times |
Fri 26 September 2025 |
1375.45 (4%) |
1312.05 |
1312.05 - 1445.85 |
1.4492 times |
Fri 19 September 2025 |
1322.60 (9.24%) |
1225.00 |
1224.95 - 1353.90 |
1.7514 times |
Fri 12 September 2025 |
1210.70 (1.12%) |
1198.05 |
1120.35 - 1235.00 |
0.9945 times |
Fri 05 September 2025 |
1197.25 (0.66%) |
1195.00 |
1180.00 - 1244.90 |
0.786 times |
Fri 29 August 2025 |
1189.35 (-0.96%) |
1216.20 |
1170.05 - 1242.80 |
0.5105 times |
Fri 22 August 2025 |
1200.85 (-0.46%) |
1239.00 |
1168.80 - 1251.90 |
2.3946 times |
Thu 14 August 2025 |
1206.40 (-16.11%) |
1425.20 |
1154.85 - 1516.75 |
2.7203 times |
Monthly price and charts Nibe Strong monthly Stock price targets for Nibe 535136 are 1168.9 and 1427.9 | Monthly Target 1 | 1114.6 | | Monthly Target 2 | 1223.2 | | Monthly Target 3 | 1373.6 | | Monthly Target 4 | 1482.2 | | Monthly Target 5 | 1632.6 |
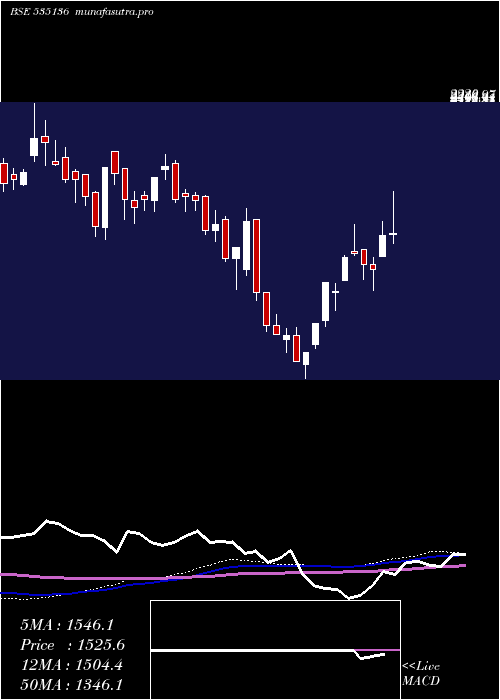
Monthly price and volumes Nibe
| Date |
Closing |
Open |
Range |
Volume |
Tue 21 October 2025 |
1331.80 (-9.59%) |
1473.25 |
1265.00 - 1524.00 |
0.1819 times |
Tue 30 September 2025 |
1473.00 (23.85%) |
1195.00 |
1120.35 - 1498.80 |
0.5948 times |
Fri 29 August 2025 |
1189.35 (-27.11%) |
1620.25 |
1154.85 - 1673.10 |
0.7769 times |
Thu 31 July 2025 |
1631.65 (-1.53%) |
1659.00 |
1572.55 - 1797.00 |
0.4987 times |
Mon 30 June 2025 |
1656.95 (-5.94%) |
1699.95 |
1602.00 - 2000.55 |
1.7504 times |
Fri 30 May 2025 |
1761.50 (33.72%) |
1325.25 |
1222.75 - 1854.20 |
1.8598 times |
Wed 30 April 2025 |
1317.35 (26.01%) |
1061.95 |
1029.65 - 1577.00 |
0.9342 times |
Fri 28 March 2025 |
1045.40 (5.71%) |
958.15 |
753.05 - 1045.40 |
0.8557 times |
Fri 28 February 2025 |
988.95 (-31.98%) |
1335.00 |
988.95 - 1660.30 |
0.9786 times |
Fri 31 January 2025 |
1453.90 (-14.96%) |
1707.00 |
1230.00 - 1730.00 |
1.5689 times |
Tue 31 December 2024 |
1709.60 (-0.02%) |
1705.00 |
1641.60 - 1949.80 |
1.6467 times |

DMA SMA EMA moving averages of Nibe 535136
DMA (daily moving average) of Nibe 535136
| DMA period | DMA value | | 5 day DMA | 1324.9 | | 12 day DMA | 1338.07 | | 20 day DMA | 1370.15 | | 35 day DMA | 1313.8 | | 50 day DMA | 1288.52 | | 100 day DMA | 1489.64 | | 150 day DMA | 1413.09 | | 200 day DMA | 1409.93 | EMA (exponential moving average) of Nibe 535136
| EMA period | EMA current | EMA prev | EMA prev2 | | 5 day EMA | 1326.58 | 1323.97 | 1322.08 | | 12 day EMA | 1336.33 | 1337.15 | 1338.86 | | 20 day EMA | 1339.14 | 1339.91 | 1341.19 | | 35 day EMA | 1335.17 | 1335.37 | 1335.82 | | 50 day EMA | 1317.89 | 1317.32 | 1316.89 |
SMA (simple moving average) of Nibe 535136
| SMA period | SMA current | SMA prev | SMA prev2 | | 5 day SMA | 1324.9 | 1312.71 | 1306.59 | | 12 day SMA | 1338.07 | 1349.08 | 1359.39 | | 20 day SMA | 1370.15 | 1371.54 | 1371.28 | | 35 day SMA | 1313.8 | 1309.72 | 1305.77 | | 50 day SMA | 1288.52 | 1293.8 | 1299.34 | | 100 day SMA | 1489.64 | 1493.98 | 1497.52 | | 150 day SMA | 1413.09 | 1410.52 | 1407.69 | | 200 day SMA | 1409.93 | 1411.62 | 1413.52 |
|
|
