Triveniturb 533655 full analysis,charts,indicators,moving averages,SMA,DMA,EMA,ADX,MACD,RSITriveniturb 533655 WideScreen charts, DMA,SMA,EMA technical analysis, forecast prediction, by indicators ADX,MACD,RSI,CCI BSE stock exchange
Daily price and charts and targets Triveniturb Strong Daily Stock price targets for Triveniturb 533655 are 539.65 and 552.2 | Daily Target 1 | 529.43 | | Daily Target 2 | 537.32 | | Daily Target 3 | 541.98333333333 | | Daily Target 4 | 549.87 | | Daily Target 5 | 554.53 |
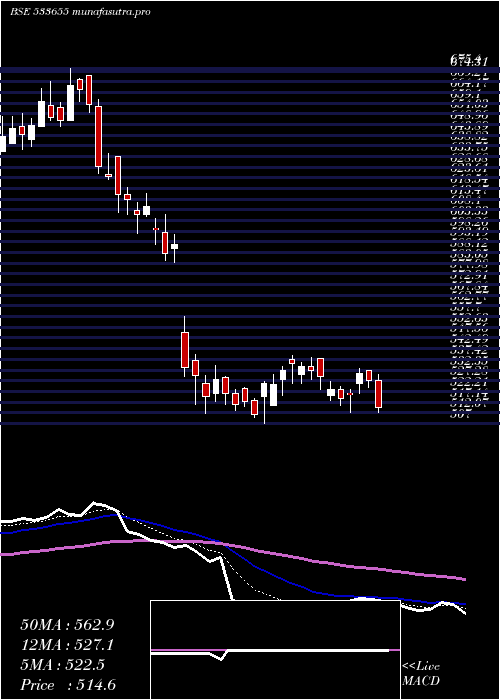
Daily price and volume Triveniturb
| Date |
Closing |
Open |
Range |
Volume |
Fri 05 December 2025 |
545.20 (1.19%) |
536.50 |
534.10 - 546.65 |
1.0408 times |
Thu 04 December 2025 |
538.80 (-1.17%) |
544.70 |
536.75 - 544.70 |
0.7285 times |
Wed 03 December 2025 |
545.20 (4.23%) |
523.05 |
523.05 - 547.95 |
2.0615 times |
Tue 02 December 2025 |
523.05 (-0.66%) |
526.95 |
520.15 - 531.10 |
0.9217 times |
Mon 01 December 2025 |
526.55 (-1.89%) |
539.95 |
518.00 - 539.95 |
1.5467 times |
Fri 28 November 2025 |
536.70 (-1%) |
520.95 |
520.90 - 543.65 |
0.7662 times |
Thu 27 November 2025 |
542.10 (-0.02%) |
542.20 |
538.05 - 546.95 |
1.0798 times |
Wed 26 November 2025 |
542.20 (0.77%) |
544.00 |
538.00 - 544.90 |
0.6418 times |
Tue 25 November 2025 |
538.05 (-0.47%) |
541.10 |
535.55 - 542.65 |
0.2337 times |
Mon 24 November 2025 |
540.60 (0.27%) |
535.65 |
534.30 - 544.00 |
0.9792 times |
Fri 21 November 2025 |
539.15 (-0.43%) |
539.75 |
536.35 - 542.00 |
0.8571 times |
Weekly price and charts Triveniturb Strong weekly Stock price targets for Triveniturb 533655 are 531.6 and 561.55 | Weekly Target 1 | 507.1 | | Weekly Target 2 | 526.15 | | Weekly Target 3 | 537.05 | | Weekly Target 4 | 556.1 | | Weekly Target 5 | 567 |
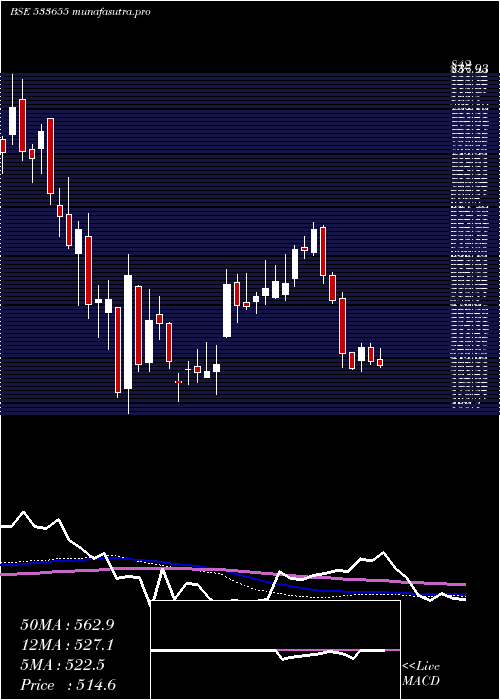
Weekly price and volumes for Triveniturb
| Date |
Closing |
Open |
Range |
Volume |
Fri 05 December 2025 |
545.20 (1.58%) |
539.95 |
518.00 - 547.95 |
1.0422 times |
Fri 28 November 2025 |
536.70 (-0.45%) |
535.65 |
520.90 - 546.95 |
0.6123 times |
Fri 21 November 2025 |
539.15 (-0.26%) |
544.00 |
529.75 - 554.00 |
1.0561 times |
Fri 14 November 2025 |
540.55 (4.93%) |
516.40 |
516.40 - 559.30 |
2.3923 times |
Fri 07 November 2025 |
515.15 (-3.74%) |
535.85 |
513.00 - 548.10 |
0.5406 times |
Fri 31 October 2025 |
535.15 (1.19%) |
522.65 |
518.00 - 540.40 |
1.0033 times |
Thu 23 October 2025 |
528.85 (1.44%) |
527.25 |
515.90 - 534.10 |
0.4817 times |
Fri 17 October 2025 |
521.35 (-1.18%) |
518.85 |
516.90 - 533.90 |
0.737 times |
Fri 10 October 2025 |
527.60 (1.16%) |
520.15 |
516.00 - 538.00 |
1.613 times |
Fri 03 October 2025 |
521.55 (1.23%) |
515.25 |
511.80 - 528.10 |
0.5215 times |
Fri 26 September 2025 |
515.20 (-3.91%) |
536.20 |
508.60 - 547.05 |
1.1742 times |
Monthly price and charts Triveniturb Strong monthly Stock price targets for Triveniturb 533655 are 531.6 and 561.55 | Monthly Target 1 | 507.1 | | Monthly Target 2 | 526.15 | | Monthly Target 3 | 537.05 | | Monthly Target 4 | 556.1 | | Monthly Target 5 | 567 |
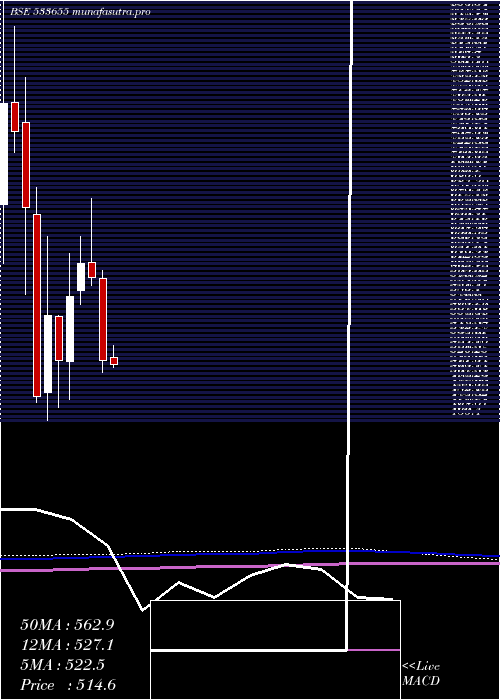
Monthly price and volumes Triveniturb
| Date |
Closing |
Open |
Range |
Volume |
Fri 05 December 2025 |
545.20 (1.58%) |
539.95 |
518.00 - 547.95 |
0.092 times |
Fri 28 November 2025 |
536.70 (0.29%) |
535.85 |
513.00 - 559.30 |
0.4062 times |
Fri 31 October 2025 |
535.15 (3.17%) |
518.70 |
515.90 - 540.40 |
0.3602 times |
Tue 30 September 2025 |
518.70 (-0.05%) |
521.20 |
505.90 - 554.00 |
0.5552 times |
Fri 29 August 2025 |
518.95 (-13.4%) |
597.75 |
507.00 - 606.00 |
0.982 times |
Thu 31 July 2025 |
599.25 (-2.21%) |
613.55 |
591.80 - 675.40 |
0.8523 times |
Mon 30 June 2025 |
612.80 (5.53%) |
586.75 |
573.15 - 639.00 |
1.1505 times |
Fri 30 May 2025 |
580.70 (11.89%) |
517.50 |
481.30 - 622.50 |
2.0408 times |
Wed 30 April 2025 |
519.00 (-7.65%) |
561.85 |
473.30 - 562.60 |
0.8522 times |
Fri 28 March 2025 |
562.00 (16.21%) |
487.95 |
460.40 - 639.00 |
2.7087 times |
Fri 28 February 2025 |
483.60 (-27.53%) |
660.05 |
478.35 - 685.85 |
1.4987 times |
DMA SMA EMA moving averages of Triveniturb 533655
DMA (daily moving average) of Triveniturb 533655
| DMA period | DMA value | | 5 day DMA | 535.76 | | 12 day DMA | 538.26 | | 20 day DMA | 536.8 | | 35 day DMA | 532.74 | | 50 day DMA | 530.09 | | 100 day DMA | 546.95 | | 150 day DMA | 560.58 | | 200 day DMA | 555.8 | EMA (exponential moving average) of Triveniturb 533655
| EMA period | EMA current | EMA prev | EMA prev2 | | 5 day EMA | 539.61 | 536.81 | 535.81 | | 12 day EMA | 537.83 | 536.49 | 536.07 | | 20 day EMA | 536.52 | 535.61 | 535.27 | | 35 day EMA | 534.28 | 533.64 | 533.34 | | 50 day EMA | 531.49 | 530.93 | 530.61 |
SMA (simple moving average) of Triveniturb 533655
| SMA period | SMA current | SMA prev | SMA prev2 | | 5 day SMA | 535.76 | 534.06 | 534.72 | | 12 day SMA | 538.26 | 537.83 | 537.75 | | 20 day SMA | 536.8 | 535.84 | 535.66 | | 35 day SMA | 532.74 | 532.16 | 531.84 | | 50 day SMA | 530.09 | 529.9 | 529.87 | | 100 day SMA | 546.95 | 547.93 | 548.95 | | 150 day SMA | 560.58 | 560.44 | 560.23 | | 200 day SMA | 555.8 | 556.25 | 556.89 |
|
|
