VaswaniInd 533576 full analysis,charts,indicators,moving averages,SMA,DMA,EMA,ADX,MACD,RSIVaswani Ind 533576 WideScreen charts, DMA,SMA,EMA technical analysis, forecast prediction, by indicators ADX,MACD,RSI,CCI BSE stock exchange
Daily price and charts and targets VaswaniInd Strong Daily Stock price targets for VaswaniInd 533576 are 55.98 and 57.98 | Daily Target 1 | 54.32 | | Daily Target 2 | 55.64 | | Daily Target 3 | 56.32 | | Daily Target 4 | 57.64 | | Daily Target 5 | 58.32 |
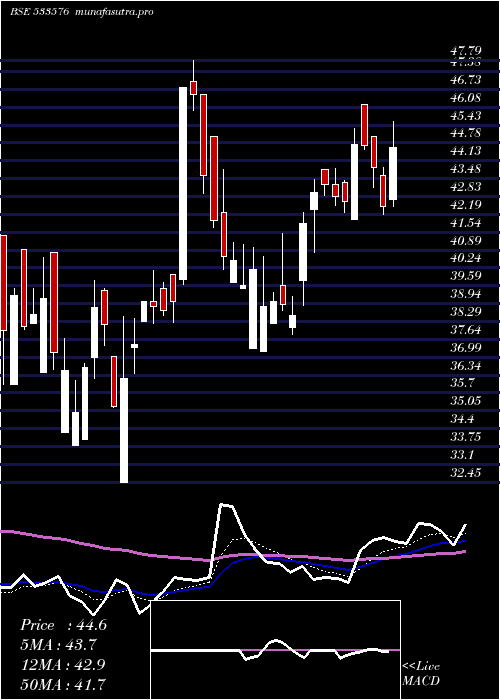
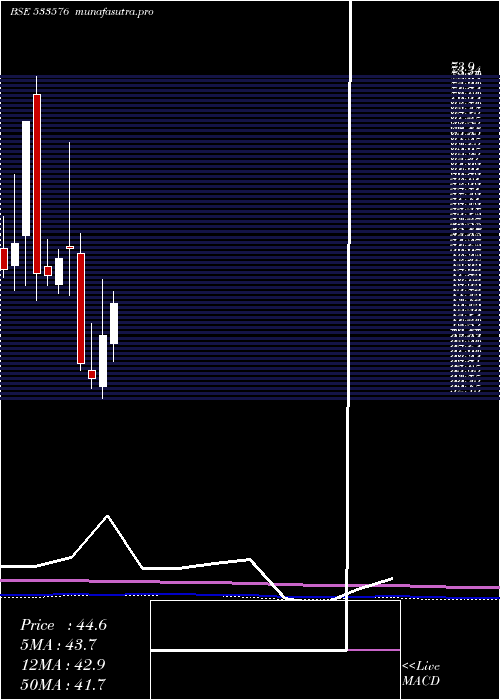
Daily price and volume Vaswani Ind
| Date |
Closing |
Open |
Range |
Volume |
Wed 03 September 2025 |
56.96 (1.62%) |
55.00 |
55.00 - 57.00 |
0.5147 times |
Tue 02 September 2025 |
56.05 (1.14%) |
56.60 |
54.12 - 57.18 |
0.1995 times |
Mon 01 September 2025 |
55.42 (-2.82%) |
57.00 |
55.00 - 59.00 |
0.5548 times |
Fri 29 August 2025 |
57.03 (-0.19%) |
55.25 |
55.25 - 59.90 |
1.2722 times |
Thu 28 August 2025 |
57.14 (4.71%) |
56.00 |
55.00 - 57.29 |
4.1316 times |
Tue 26 August 2025 |
54.57 (3.29%) |
53.20 |
52.01 - 55.00 |
1.1091 times |
Mon 25 August 2025 |
52.83 (2.56%) |
53.90 |
50.60 - 53.90 |
0.2978 times |
Fri 22 August 2025 |
51.51 (-4.08%) |
52.82 |
51.30 - 53.87 |
1.4404 times |
Thu 21 August 2025 |
53.70 (-0.68%) |
55.75 |
53.10 - 55.75 |
0.0687 times |
Wed 20 August 2025 |
54.07 (1.24%) |
52.50 |
52.50 - 55.99 |
0.4111 times |
Tue 19 August 2025 |
53.41 (0.55%) |
54.00 |
52.20 - 55.00 |
0.6442 times |
Weekly price and charts VaswaniInd Strong weekly Stock price targets for VaswaniInd 533576 are 53.1 and 57.98 | Weekly Target 1 | 51.81 | | Weekly Target 2 | 54.39 | | Weekly Target 3 | 56.693333333333 | | Weekly Target 4 | 59.27 | | Weekly Target 5 | 61.57 |
Weekly price and volumes for Vaswani Ind
| Date |
Closing |
Open |
Range |
Volume |
Wed 03 September 2025 |
56.96 (-0.12%) |
57.00 |
54.12 - 59.00 |
0.1433 times |
Fri 29 August 2025 |
57.03 (10.72%) |
53.90 |
50.60 - 59.90 |
0.7688 times |
Fri 22 August 2025 |
51.51 (1.16%) |
53.46 |
51.20 - 55.99 |
0.4217 times |
Thu 14 August 2025 |
50.92 (-0.64%) |
53.00 |
50.10 - 53.70 |
0.3768 times |
Fri 08 August 2025 |
51.25 (-6.63%) |
55.00 |
51.00 - 56.60 |
0.3686 times |
Fri 01 August 2025 |
54.89 (1.84%) |
53.35 |
50.70 - 55.86 |
0.1761 times |
Fri 25 July 2025 |
53.90 (6.94%) |
47.90 |
47.88 - 57.48 |
0.2465 times |
Fri 18 July 2025 |
50.40 (-14.07%) |
59.99 |
50.40 - 66.70 |
1.1304 times |
Fri 11 July 2025 |
58.65 (16.62%) |
49.23 |
48.35 - 60.76 |
2.9986 times |
Fri 04 July 2025 |
50.29 (11.04%) |
44.78 |
44.14 - 53.56 |
3.3691 times |
Fri 27 June 2025 |
45.29 (3.76%) |
42.20 |
42.20 - 46.57 |
0.1212 times |

Monthly price and charts VaswaniInd Strong monthly Stock price targets for VaswaniInd 533576 are 53.1 and 57.98 | Monthly Target 1 | 51.81 | | Monthly Target 2 | 54.39 | | Monthly Target 3 | 56.693333333333 | | Monthly Target 4 | 59.27 | | Monthly Target 5 | 61.57 |
Monthly price and volumes Vaswani Ind
| Date |
Closing |
Open |
Range |
Volume |
Wed 03 September 2025 |
56.96 (-0.12%) |
57.00 |
54.12 - 59.00 |
0.0575 times |
Fri 29 August 2025 |
57.03 (6.88%) |
55.30 |
50.10 - 59.90 |
0.7831 times |
Thu 31 July 2025 |
53.36 (18.97%) |
45.19 |
44.14 - 66.70 |
3.1698 times |
Mon 30 June 2025 |
44.85 (-0.09%) |
44.00 |
42.20 - 50.00 |
0.701 times |
Fri 30 May 2025 |
44.89 (10.84%) |
39.49 |
37.21 - 46.19 |
0.8543 times |
Wed 30 April 2025 |
40.50 (15.78%) |
34.00 |
32.45 - 47.79 |
0.5006 times |
Fri 28 March 2025 |
34.98 (-5.33%) |
36.00 |
33.77 - 42.14 |
1.0324 times |
Fri 28 February 2025 |
36.95 (-28.64%) |
51.04 |
36.00 - 53.70 |
0.903 times |
Fri 31 January 2025 |
51.78 (2.74%) |
51.99 |
45.70 - 65.34 |
1.628 times |
Tue 31 December 2024 |
50.40 (4.41%) |
47.10 |
46.00 - 51.60 |
0.3702 times |
Fri 29 November 2024 |
48.27 (-0.41%) |
49.45 |
47.01 - 52.90 |
0.2284 times |
DMA SMA EMA moving averages of Vaswani Ind 533576
DMA (daily moving average) of Vaswani Ind 533576
| DMA period | DMA value | | 5 day DMA | 56.52 | | 12 day DMA | 54.65 | | 20 day DMA | 53.55 | | 35 day DMA | 53.81 | | 50 day DMA | 52.34 | | 100 day DMA | 47.49 | | 150 day DMA | 46.11 | | 200 day DMA | 47.18 | EMA (exponential moving average) of Vaswani Ind 533576
| EMA period | EMA current | EMA prev | EMA prev2 | | 5 day EMA | 56.07 | 55.63 | 55.42 | | 12 day EMA | 54.97 | 54.61 | 54.35 | | 20 day EMA | 54.23 | 53.94 | 53.72 | | 35 day EMA | 52.98 | 52.75 | 52.56 | | 50 day EMA | 52.18 | 51.99 | 51.82 |
SMA (simple moving average) of Vaswani Ind 533576
| SMA period | SMA current | SMA prev | SMA prev2 | | 5 day SMA | 56.52 | 56.04 | 55.4 | | 12 day SMA | 54.65 | 54.15 | 53.83 | | 20 day SMA | 53.55 | 53.35 | 53.29 | | 35 day SMA | 53.81 | 53.92 | 54 | | 50 day SMA | 52.34 | 52.08 | 51.83 | | 100 day SMA | 47.49 | 47.31 | 47.11 | | 150 day SMA | 46.11 | 46.08 | 46.05 | | 200 day SMA | 47.18 | 47.14 | 47.11 |
|
|
