Ebixforex 533452 full analysis,charts,indicators,moving averages,SMA,DMA,EMA,ADX,MACD,RSIEbixforex 533452 WideScreen charts, DMA,SMA,EMA technical analysis, forecast prediction, by indicators ADX,MACD,RSI,CCI BSE stock exchange
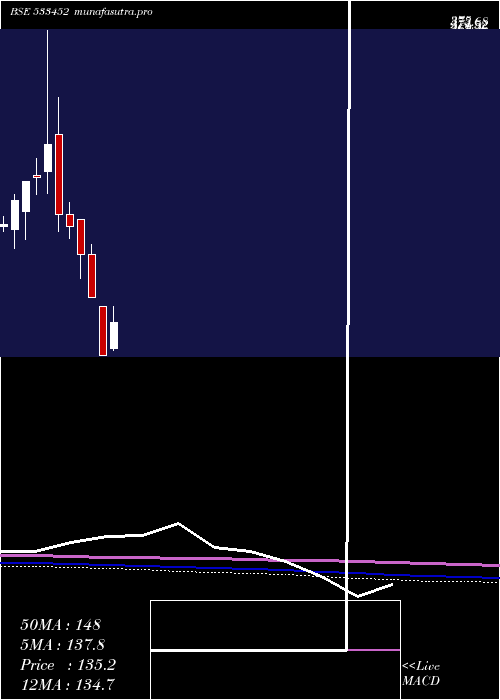
Daily price and charts and targets Ebixforex Strong Daily Stock price targets for Ebixforex 533452 are 208.2 and 215.2 | Daily Target 1 | 202.47 | | Daily Target 2 | 206.93 | | Daily Target 3 | 209.46666666667 | | Daily Target 4 | 213.93 | | Daily Target 5 | 216.47 |
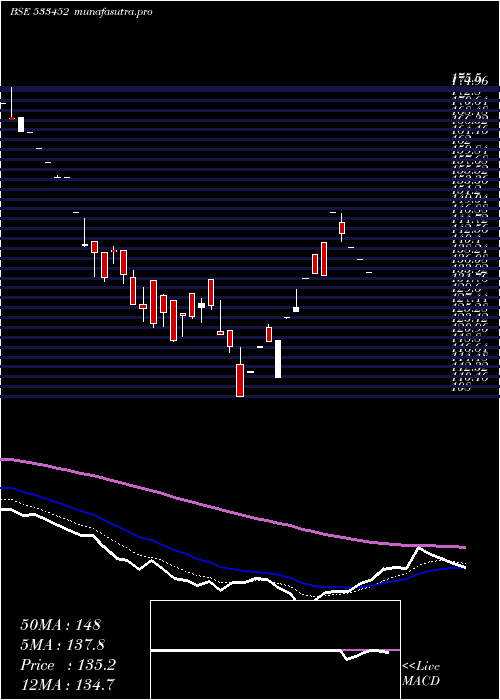
Daily price and volume Ebixforex
| Date |
Closing |
Open |
Range |
Volume |
Wed 03 September 2025 |
211.40 (0.21%) |
205.00 |
205.00 - 212.00 |
1.7034 times |
Tue 02 September 2025 |
210.95 (1.47%) |
211.00 |
205.00 - 211.00 |
3.3517 times |
Mon 01 September 2025 |
207.90 (-1%) |
207.90 |
205.80 - 207.90 |
0.5617 times |
Fri 29 August 2025 |
210.00 (3.45%) |
199.90 |
195.50 - 210.95 |
1.2847 times |
Thu 28 August 2025 |
203.00 (2.11%) |
203.00 |
203.00 - 203.00 |
0.2451 times |
Tue 26 August 2025 |
198.80 (2.13%) |
194.70 |
185.10 - 199.30 |
0.8517 times |
Mon 25 August 2025 |
194.65 (-4.98%) |
200.00 |
194.65 - 204.80 |
0.2206 times |
Fri 22 August 2025 |
204.85 (3.46%) |
204.85 |
204.85 - 204.85 |
0.002 times |
Thu 21 August 2025 |
198.00 (-4.92%) |
214.95 |
198.00 - 214.95 |
1.1622 times |
Wed 20 August 2025 |
208.25 (4.13%) |
198.00 |
191.30 - 209.00 |
0.6168 times |
Tue 19 August 2025 |
200.00 (0.58%) |
189.50 |
189.50 - 204.90 |
0.2083 times |
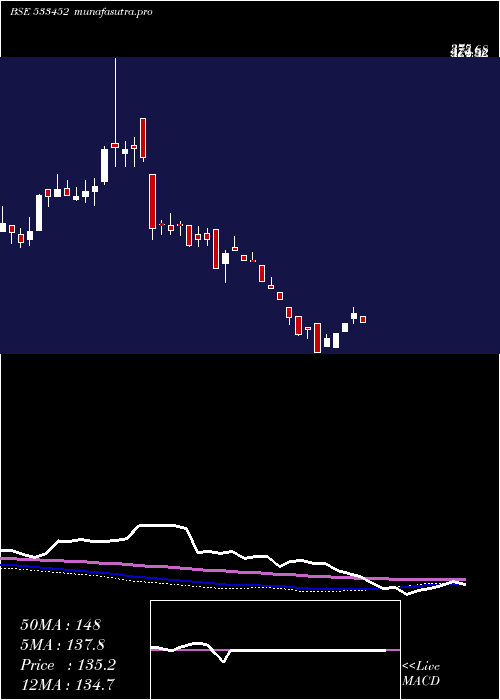
Weekly price and charts Ebixforex Strong weekly Stock price targets for Ebixforex 533452 are 208.2 and 215.2 | Weekly Target 1 | 202.47 | | Weekly Target 2 | 206.93 | | Weekly Target 3 | 209.46666666667 | | Weekly Target 4 | 213.93 | | Weekly Target 5 | 216.47 |
Weekly price and volumes for Ebixforex
| Date |
Closing |
Open |
Range |
Volume |
Wed 03 September 2025 |
211.40 (0.67%) |
207.90 |
205.00 - 212.00 |
0.1182 times |
Fri 29 August 2025 |
210.00 (2.51%) |
200.00 |
185.10 - 210.95 |
0.0547 times |
Fri 22 August 2025 |
204.85 (-1.87%) |
206.70 |
189.50 - 214.95 |
0.0753 times |
Thu 14 August 2025 |
208.75 (7.6%) |
194.00 |
191.00 - 211.95 |
0.0995 times |
Fri 08 August 2025 |
194.00 (-7.97%) |
210.80 |
189.00 - 210.80 |
0.1294 times |
Fri 01 August 2025 |
210.80 (-6.33%) |
229.20 |
210.80 - 229.20 |
0.0391 times |
Fri 25 July 2025 |
225.05 (-5.84%) |
241.35 |
214.25 - 241.35 |
0.2852 times |
Fri 18 July 2025 |
239.00 (1.01%) |
240.00 |
227.10 - 244.25 |
0.2989 times |
Fri 11 July 2025 |
236.60 (7.25%) |
215.00 |
206.00 - 242.65 |
1.244 times |
Fri 04 July 2025 |
220.60 (45.18%) |
148.20 |
148.20 - 245.15 |
7.6556 times |
Fri 27 June 2025 |
151.95 (2.25%) |
152.70 |
142.05 - 179.00 |
0.4974 times |
Monthly price and charts Ebixforex Strong monthly Stock price targets for Ebixforex 533452 are 208.2 and 215.2 | Monthly Target 1 | 202.47 | | Monthly Target 2 | 206.93 | | Monthly Target 3 | 209.46666666667 | | Monthly Target 4 | 213.93 | | Monthly Target 5 | 216.47 |
Monthly price and volumes Ebixforex
| Date |
Closing |
Open |
Range |
Volume |
Wed 03 September 2025 |
211.40 (0.67%) |
207.90 |
205.00 - 212.00 |
0.0431 times |
Fri 29 August 2025 |
210.00 (-5.34%) |
211.20 |
185.10 - 215.00 |
0.1352 times |
Thu 31 July 2025 |
221.85 (39.27%) |
162.15 |
160.80 - 245.15 |
3.4189 times |
Mon 30 June 2025 |
159.30 (24.45%) |
128.00 |
120.50 - 179.00 |
3.8783 times |
Fri 30 May 2025 |
128.00 (-5.33%) |
132.50 |
123.85 - 132.50 |
0.3372 times |
Wed 30 April 2025 |
135.20 (25.19%) |
113.35 |
112.25 - 148.20 |
0.0902 times |
Fri 28 March 2025 |
108.00 (-30.72%) |
148.15 |
108.00 - 148.15 |
1.2199 times |
Fri 28 February 2025 |
155.90 (-18.42%) |
191.10 |
155.90 - 198.75 |
0.1342 times |
Thu 30 January 2025 |
191.10 (-10.7%) |
219.95 |
171.10 - 219.95 |
0.4712 times |
Tue 31 December 2024 |
214.00 (-4.42%) |
223.50 |
203.95 - 234.00 |
0.2718 times |
Fri 29 November 2024 |
223.90 (-20.38%) |
289.80 |
210.00 - 320.00 |
0.4734 times |
DMA SMA EMA moving averages of Ebixforex 533452
DMA (daily moving average) of Ebixforex 533452
| DMA period | DMA value | | 5 day DMA | 208.65 | | 12 day DMA | 203.89 | | 20 day DMA | 202.23 | | 35 day DMA | 212.99 | | 50 day DMA | 208.06 | | 100 day DMA | 169.71 | | 150 day DMA | 171.68 | | 200 day DMA | 190.86 | EMA (exponential moving average) of Ebixforex 533452
| EMA period | EMA current | EMA prev | EMA prev2 | | 5 day EMA | 208.55 | 207.12 | 205.21 | | 12 day EMA | 206.09 | 205.12 | 204.06 | | 20 day EMA | 205.75 | 205.15 | 204.54 | | 35 day EMA | 203.61 | 203.15 | 202.69 | | 50 day EMA | 203.9 | 203.59 | 203.29 |
SMA (simple moving average) of Ebixforex 533452
| SMA period | SMA current | SMA prev | SMA prev2 | | 5 day SMA | 208.65 | 206.13 | 202.87 | | 12 day SMA | 203.89 | 203.67 | 203.42 | | 20 day SMA | 202.23 | 202.06 | 202.05 | | 35 day SMA | 212.99 | 213.72 | 214.45 | | 50 day SMA | 208.06 | 206.73 | 205.49 | | 100 day SMA | 169.71 | 168.85 | 167.95 | | 150 day SMA | 171.68 | 171.7 | 171.73 | | 200 day SMA | 190.86 | 191.22 | 191.58 |
|
|
