IndTerrain 533329 full analysis,charts,indicators,moving averages,SMA,DMA,EMA,ADX,MACD,RSIInd Terrain 533329 WideScreen charts, DMA,SMA,EMA technical analysis, forecast prediction, by indicators ADX,MACD,RSI,CCI BSE stock exchange
Daily price and charts and targets IndTerrain Strong Daily Stock price targets for IndTerrain 533329 are 36.11 and 38.66 | Daily Target 1 | 34.27 | | Daily Target 2 | 35.39 | | Daily Target 3 | 36.823333333333 | | Daily Target 4 | 37.94 | | Daily Target 5 | 39.37 |
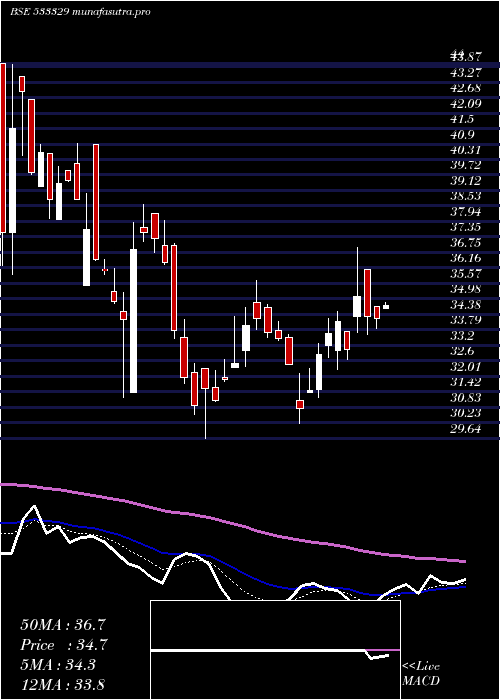
Daily price and volume Ind Terrain
| Date |
Closing |
Open |
Range |
Volume |
Thu 23 October 2025 |
36.50 (1.9%) |
35.71 |
35.71 - 38.26 |
0.6337 times |
Tue 21 October 2025 |
35.82 (-1.24%) |
35.90 |
35.47 - 36.75 |
0.1588 times |
Mon 20 October 2025 |
36.27 (1.88%) |
35.24 |
35.24 - 36.55 |
0.9492 times |
Fri 17 October 2025 |
35.60 (-0.42%) |
35.39 |
35.39 - 35.73 |
0.5662 times |
Thu 16 October 2025 |
35.75 (-0.08%) |
35.80 |
35.33 - 35.80 |
0.1729 times |
Wed 15 October 2025 |
35.78 (-1.54%) |
36.07 |
35.00 - 36.90 |
1.1577 times |
Tue 14 October 2025 |
36.34 (1.08%) |
35.99 |
35.68 - 36.64 |
0.2226 times |
Mon 13 October 2025 |
35.95 (1.93%) |
34.51 |
34.50 - 36.00 |
1.9371 times |
Fri 10 October 2025 |
35.27 (1.91%) |
34.50 |
34.50 - 35.70 |
2.7992 times |
Thu 09 October 2025 |
34.61 (-2.04%) |
35.92 |
34.50 - 36.04 |
1.4026 times |
Wed 08 October 2025 |
35.33 (-3.21%) |
36.13 |
35.20 - 38.80 |
18.6393 times |
Weekly price and charts IndTerrain Strong weekly Stock price targets for IndTerrain 533329 are 35.87 and 38.89 | Weekly Target 1 | 33.65 | | Weekly Target 2 | 35.07 | | Weekly Target 3 | 36.666666666667 | | Weekly Target 4 | 38.09 | | Weekly Target 5 | 39.69 |
Weekly price and volumes for Ind Terrain
| Date |
Closing |
Open |
Range |
Volume |
Thu 23 October 2025 |
36.50 (2.53%) |
35.24 |
35.24 - 38.26 |
0.0793 times |
Fri 17 October 2025 |
35.60 (0.94%) |
34.51 |
34.50 - 36.90 |
0.1846 times |
Fri 10 October 2025 |
35.27 (-4.83%) |
37.30 |
34.50 - 39.85 |
1.372 times |
Fri 03 October 2025 |
37.06 (15.45%) |
32.30 |
32.13 - 37.52 |
0.6505 times |
Fri 26 September 2025 |
32.10 (-9.01%) |
37.00 |
31.52 - 37.00 |
0.3926 times |
Fri 19 September 2025 |
35.28 (7.43%) |
32.86 |
32.51 - 36.90 |
0.5949 times |
Fri 12 September 2025 |
32.84 (-3.5%) |
34.34 |
32.60 - 34.75 |
0.3223 times |
Fri 05 September 2025 |
34.03 (-4.46%) |
35.38 |
33.96 - 36.35 |
0.4595 times |
Fri 29 August 2025 |
35.62 (-4.04%) |
40.26 |
34.32 - 40.26 |
0.5533 times |
Fri 22 August 2025 |
37.12 (6.09%) |
36.09 |
35.98 - 38.78 |
5.3911 times |
Thu 14 August 2025 |
34.99 (-0.91%) |
35.31 |
34.51 - 39.99 |
0.3541 times |

Monthly price and charts IndTerrain Strong monthly Stock price targets for IndTerrain 533329 are 34.79 and 41.57 | Monthly Target 1 | 29.69 | | Monthly Target 2 | 33.1 | | Monthly Target 3 | 36.473333333333 | | Monthly Target 4 | 39.88 | | Monthly Target 5 | 43.25 |
Monthly price and volumes Ind Terrain
| Date |
Closing |
Open |
Range |
Volume |
Thu 23 October 2025 |
36.50 (10.91%) |
33.37 |
33.07 - 39.85 |
0.5947 times |
Tue 30 September 2025 |
32.91 (-7.61%) |
35.38 |
31.52 - 37.00 |
0.5076 times |
Fri 29 August 2025 |
35.62 (-7.6%) |
38.70 |
34.32 - 40.26 |
1.8289 times |
Thu 31 July 2025 |
38.55 (4.81%) |
37.08 |
36.52 - 43.66 |
0.7838 times |
Mon 30 June 2025 |
36.78 (-12.53%) |
42.49 |
35.10 - 44.00 |
0.8864 times |
Fri 30 May 2025 |
42.05 (24.78%) |
33.07 |
31.61 - 44.90 |
0.9577 times |
Wed 30 April 2025 |
33.70 (9.52%) |
31.39 |
31.21 - 38.75 |
0.5483 times |
Fri 28 March 2025 |
30.77 (-11.73%) |
34.50 |
29.64 - 38.58 |
2.4165 times |
Fri 28 February 2025 |
34.86 (-16.4%) |
41.05 |
34.81 - 44.00 |
0.391 times |
Fri 31 January 2025 |
41.70 (-13.05%) |
49.90 |
37.92 - 51.00 |
1.0851 times |
Tue 31 December 2024 |
47.96 (0.33%) |
47.86 |
47.25 - 56.74 |
1.3618 times |

DMA SMA EMA moving averages of Ind Terrain 533329
DMA (daily moving average) of Ind Terrain 533329
| DMA period | DMA value | | 5 day DMA | 35.99 | | 12 day DMA | 35.81 | | 20 day DMA | 35.12 | | 35 day DMA | 34.86 | | 50 day DMA | 35.21 | | 100 day DMA | 36.97 | | 150 day DMA | 36.26 | | 200 day DMA | 37.71 | EMA (exponential moving average) of Ind Terrain 533329
| EMA period | EMA current | EMA prev | EMA prev2 | | 5 day EMA | 36.08 | 35.87 | 35.9 | | 12 day EMA | 35.76 | 35.63 | 35.59 | | 20 day EMA | 35.5 | 35.4 | 35.36 | | 35 day EMA | 35.4 | 35.34 | 35.31 | | 50 day EMA | 35.35 | 35.3 | 35.28 |
SMA (simple moving average) of Ind Terrain 533329
| SMA period | SMA current | SMA prev | SMA prev2 | | 5 day SMA | 35.99 | 35.84 | 35.95 | | 12 day SMA | 35.81 | 35.85 | 35.95 | | 20 day SMA | 35.12 | 35.02 | 35.01 | | 35 day SMA | 34.86 | 34.84 | 34.82 | | 50 day SMA | 35.21 | 35.19 | 35.19 | | 100 day SMA | 36.97 | 37.05 | 37.11 | | 150 day SMA | 36.26 | 36.27 | 36.28 | | 200 day SMA | 37.71 | 37.78 | 37.85 |
|
|
