RdbRealty 533285 full analysis,charts,indicators,moving averages,SMA,DMA,EMA,ADX,MACD,RSIRdb Realty 533285 WideScreen charts, DMA,SMA,EMA technical analysis, forecast prediction, by indicators ADX,MACD,RSI,CCI BSE stock exchange
Daily price and charts and targets RdbRealty Strong Daily Stock price targets for RdbRealty 533285 are 48.7 and 53.63 | Daily Target 1 | 44.7 | | Daily Target 2 | 47.76 | | Daily Target 3 | 49.63 | | Daily Target 4 | 52.69 | | Daily Target 5 | 54.56 |
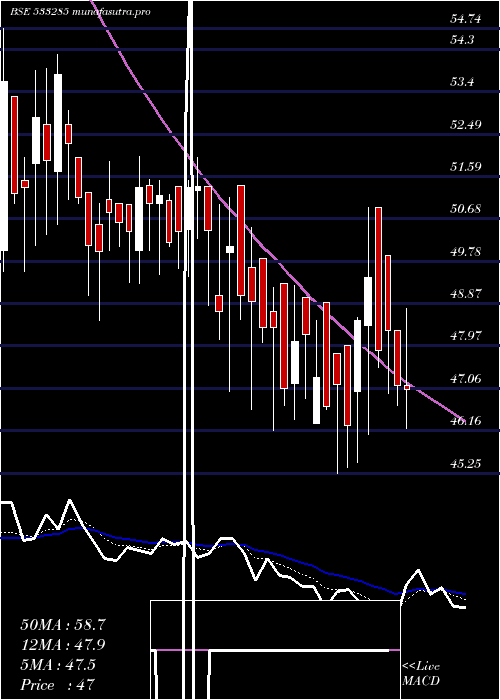
Daily price and volume Rdb Realty
| Date |
Closing |
Open |
Range |
Volume |
Fri 05 December 2025 |
50.82 (8.66%) |
48.25 |
46.57 - 51.50 |
3.7675 times |
Thu 04 December 2025 |
46.77 (-1.91%) |
47.68 |
46.50 - 48.79 |
0.1517 times |
Wed 03 December 2025 |
47.68 (-0.73%) |
48.00 |
47.31 - 48.70 |
0.1634 times |
Tue 02 December 2025 |
48.03 (-1.17%) |
48.60 |
47.25 - 49.99 |
0.157 times |
Mon 01 December 2025 |
48.60 (0.58%) |
47.10 |
46.28 - 50.50 |
1.8825 times |
Fri 28 November 2025 |
48.32 (2.87%) |
46.20 |
46.00 - 50.40 |
1.1328 times |
Thu 27 November 2025 |
46.97 (-1.47%) |
47.67 |
46.50 - 47.89 |
0.2712 times |
Wed 26 November 2025 |
47.67 (3.38%) |
45.11 |
45.11 - 50.00 |
0.8425 times |
Tue 25 November 2025 |
46.11 (-2.14%) |
48.74 |
45.80 - 48.74 |
0.5622 times |
Mon 24 November 2025 |
47.12 (-4.62%) |
48.00 |
46.50 - 50.00 |
1.0691 times |
Fri 21 November 2025 |
49.40 (-1.61%) |
50.00 |
48.60 - 53.00 |
0.9121 times |
Weekly price and charts RdbRealty Strong weekly Stock price targets for RdbRealty 533285 are 48.55 and 53.77 | Weekly Target 1 | 44.31 | | Weekly Target 2 | 47.57 | | Weekly Target 3 | 49.533333333333 | | Weekly Target 4 | 52.79 | | Weekly Target 5 | 54.75 |
Weekly price and volumes for Rdb Realty
| Date |
Closing |
Open |
Range |
Volume |
Fri 05 December 2025 |
50.82 (5.17%) |
47.10 |
46.28 - 51.50 |
0.9917 times |
Fri 28 November 2025 |
48.32 (-2.19%) |
48.00 |
45.11 - 50.40 |
0.6282 times |
Fri 21 November 2025 |
49.40 (-0.84%) |
50.40 |
46.50 - 53.00 |
0.4341 times |
Fri 14 November 2025 |
49.82 (-6.11%) |
54.49 |
46.00 - 56.00 |
2.8848 times |
Fri 07 November 2025 |
53.06 (4.1%) |
51.99 |
49.02 - 53.90 |
1.0895 times |
Fri 31 October 2025 |
50.97 (7.62%) |
47.05 |
45.00 - 53.99 |
1.129 times |
Thu 23 October 2025 |
47.36 (-0.92%) |
49.49 |
46.25 - 50.99 |
0.1373 times |
Fri 17 October 2025 |
47.80 (1.12%) |
45.00 |
42.11 - 49.50 |
0.4133 times |
Fri 10 October 2025 |
47.27 (-0.92%) |
49.00 |
44.21 - 49.00 |
0.277 times |
Fri 03 October 2025 |
47.71 (1.3%) |
48.00 |
43.51 - 48.50 |
2.0151 times |
Fri 26 September 2025 |
47.10 (2.95%) |
45.00 |
45.00 - 49.95 |
0.9259 times |
Monthly price and charts RdbRealty Strong monthly Stock price targets for RdbRealty 533285 are 48.55 and 53.77 | Monthly Target 1 | 44.31 | | Monthly Target 2 | 47.57 | | Monthly Target 3 | 49.533333333333 | | Monthly Target 4 | 52.79 | | Monthly Target 5 | 54.75 |
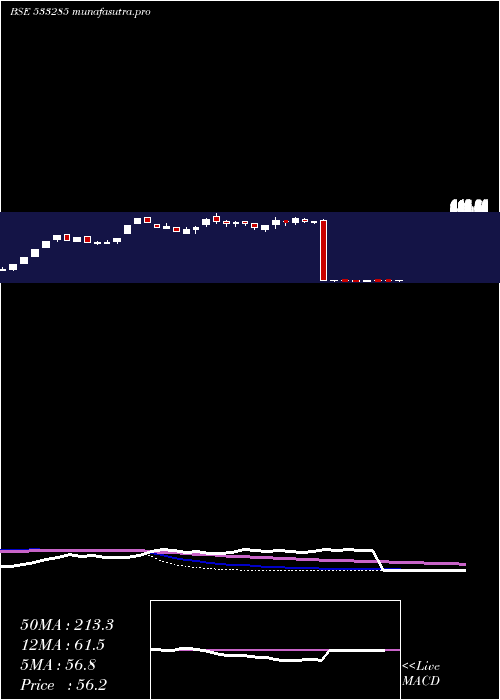
Monthly price and volumes Rdb Realty
| Date |
Closing |
Open |
Range |
Volume |
Fri 05 December 2025 |
50.82 (5.17%) |
47.10 |
46.28 - 51.50 |
0.2327 times |
Fri 28 November 2025 |
48.32 (-5.2%) |
51.99 |
45.11 - 56.00 |
1.1816 times |
Fri 31 October 2025 |
50.97 (13.7%) |
44.55 |
42.11 - 53.99 |
0.5484 times |
Tue 30 September 2025 |
44.83 (21.13%) |
37.75 |
35.00 - 49.95 |
1.0759 times |
Fri 29 August 2025 |
37.01 (-21.47%) |
47.13 |
36.26 - 48.76 |
0.6959 times |
Thu 31 July 2025 |
47.13 (-7.9%) |
51.08 |
45.25 - 52.00 |
1.3981 times |
Mon 30 June 2025 |
51.17 (1.55%) |
50.00 |
47.51 - 54.74 |
0.7231 times |
Fri 30 May 2025 |
50.39 (-6.74%) |
54.03 |
48.50 - 56.30 |
1.0541 times |
Wed 30 April 2025 |
54.03 (-9.15%) |
60.80 |
52.00 - 62.68 |
0.9019 times |
Fri 28 March 2025 |
59.47 (4.89%) |
56.70 |
51.00 - 61.00 |
2.1885 times |
Fri 28 February 2025 |
56.70 (-89.62%) |
537.05 |
54.50 - 578.20 |
0.136 times |

DMA SMA EMA moving averages of Rdb Realty 533285
DMA (daily moving average) of Rdb Realty 533285
| DMA period | DMA value | | 5 day DMA | 48.38 | | 12 day DMA | 48.14 | | 20 day DMA | 48.99 | | 35 day DMA | 48.76 | | 50 day DMA | 48.23 | | 100 day DMA | 46.14 | | 150 day DMA | 47.94 | | 200 day DMA | 92.4 | EMA (exponential moving average) of Rdb Realty 533285
| EMA period | EMA current | EMA prev | EMA prev2 | | 5 day EMA | 48.63 | 47.53 | 47.91 | | 12 day EMA | 48.43 | 47.99 | 48.21 | | 20 day EMA | 48.51 | 48.27 | 48.43 | | 35 day EMA | 48.23 | 48.08 | 48.16 | | 50 day EMA | 48.01 | 47.9 | 47.95 |
SMA (simple moving average) of Rdb Realty 533285
| SMA period | SMA current | SMA prev | SMA prev2 | | 5 day SMA | 48.38 | 47.88 | 47.92 | | 12 day SMA | 48.14 | 47.84 | 47.92 | | 20 day SMA | 48.99 | 49.09 | 49.35 | | 35 day SMA | 48.76 | 48.64 | 48.65 | | 50 day SMA | 48.23 | 48.13 | 48.12 | | 100 day SMA | 46.14 | 46.14 | 46.16 | | 150 day SMA | 47.94 | 47.96 | 48.01 | | 200 day SMA | 92.4 | 94.83 | 97.33 |
|
|
