GoenkaDiam 533189 full analysis,charts,indicators,moving averages,SMA,DMA,EMA,ADX,MACD,RSIGoenka Diam 533189 WideScreen charts, DMA,SMA,EMA technical analysis, forecast prediction, by indicators ADX,MACD,RSI,CCI BSE stock exchange
Daily price and charts and targets GoenkaDiam Strong Daily Stock price targets for GoenkaDiam 533189 are 1.31 and 1.41 | Daily Target 1 | 1.22 | | Daily Target 2 | 1.29 | | Daily Target 3 | 1.3233333333333 | | Daily Target 4 | 1.39 | | Daily Target 5 | 1.42 |
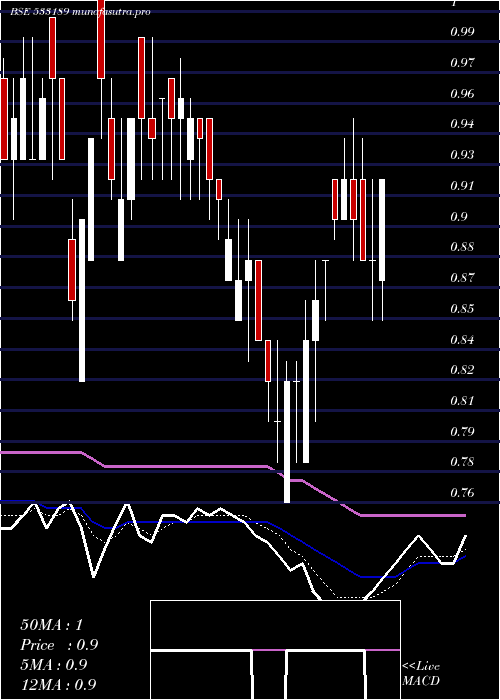
Daily price and volume Goenka Diam
| Date |
Closing |
Open |
Range |
Volume |
Tue 21 October 2025 |
1.35 (3.85%) |
1.26 |
1.26 - 1.36 |
1.1495 times |
Mon 20 October 2025 |
1.30 (4.84%) |
1.24 |
1.22 - 1.30 |
0.6915 times |
Fri 17 October 2025 |
1.24 (4.2%) |
1.19 |
1.15 - 1.24 |
0.9291 times |
Thu 16 October 2025 |
1.19 (4.39%) |
1.14 |
1.10 - 1.19 |
1.7424 times |
Wed 15 October 2025 |
1.14 (4.59%) |
1.09 |
1.06 - 1.14 |
0.9248 times |
Tue 14 October 2025 |
1.09 (-1.8%) |
1.10 |
1.06 - 1.16 |
1.0381 times |
Mon 13 October 2025 |
1.11 (3.74%) |
1.10 |
1.02 - 1.12 |
0.5977 times |
Fri 10 October 2025 |
1.07 (3.88%) |
1.03 |
0.99 - 1.07 |
1.5899 times |
Thu 09 October 2025 |
1.03 (3%) |
1.05 |
1.00 - 1.05 |
0.8052 times |
Wed 08 October 2025 |
1.00 (4.17%) |
1.00 |
0.97 - 1.00 |
0.5319 times |
Tue 07 October 2025 |
0.96 (0%) |
0.92 |
0.92 - 1.00 |
0.1754 times |
Weekly price and charts GoenkaDiam Strong weekly Stock price targets for GoenkaDiam 533189 are 1.29 and 1.43 | Weekly Target 1 | 1.17 | | Weekly Target 2 | 1.26 | | Weekly Target 3 | 1.31 | | Weekly Target 4 | 1.4 | | Weekly Target 5 | 1.45 |
Weekly price and volumes for Goenka Diam
| Date |
Closing |
Open |
Range |
Volume |
Tue 21 October 2025 |
1.35 (8.87%) |
1.24 |
1.22 - 1.36 |
0.6094 times |
Fri 17 October 2025 |
1.24 (15.89%) |
1.10 |
1.02 - 1.24 |
1.7321 times |
Fri 10 October 2025 |
1.07 (5.94%) |
1.06 |
0.92 - 1.07 |
1.1481 times |
Fri 03 October 2025 |
1.01 (5.21%) |
0.96 |
0.92 - 1.01 |
0.5019 times |
Fri 26 September 2025 |
0.96 (-10.28%) |
1.08 |
0.96 - 1.08 |
0.4655 times |
Fri 19 September 2025 |
1.07 (13.83%) |
0.96 |
0.92 - 1.10 |
2.1894 times |
Fri 12 September 2025 |
0.94 (1.08%) |
0.95 |
0.90 - 0.98 |
1.0947 times |
Fri 05 September 2025 |
0.93 (0%) |
0.95 |
0.90 - 1.00 |
0.8826 times |
Fri 29 August 2025 |
0.93 (1.09%) |
0.92 |
0.87 - 0.96 |
0.5366 times |
Fri 22 August 2025 |
0.92 (9.52%) |
0.86 |
0.82 - 0.95 |
0.8395 times |
Thu 14 August 2025 |
0.84 (-1.18%) |
0.85 |
0.81 - 0.88 |
0.4223 times |

Monthly price and charts GoenkaDiam Strong monthly Stock price targets for GoenkaDiam 533189 are 1.14 and 1.58 | Monthly Target 1 | 0.77 | | Monthly Target 2 | 1.06 | | Monthly Target 3 | 1.21 | | Monthly Target 4 | 1.5 | | Monthly Target 5 | 1.65 |
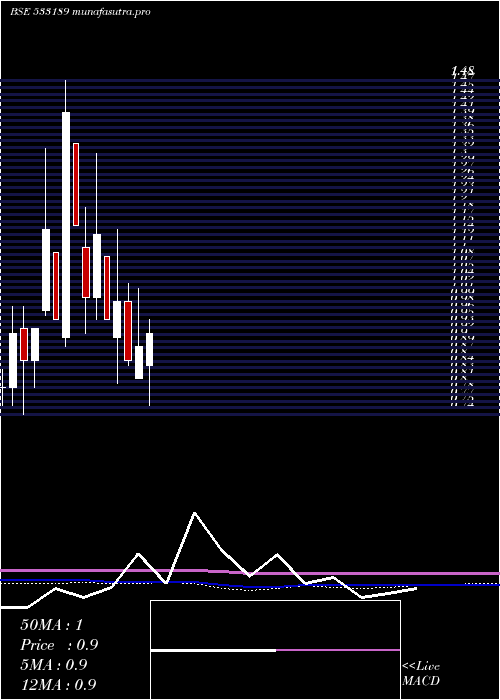
Monthly price and volumes Goenka Diam
| Date |
Closing |
Open |
Range |
Volume |
Tue 21 October 2025 |
1.35 (45.16%) |
0.97 |
0.92 - 1.36 |
1.2605 times |
Tue 30 September 2025 |
0.93 (0%) |
0.95 |
0.90 - 1.10 |
1.796 times |
Fri 29 August 2025 |
0.93 (10.71%) |
0.84 |
0.78 - 0.96 |
0.793 times |
Thu 31 July 2025 |
0.84 (-4.55%) |
0.88 |
0.81 - 0.95 |
0.8389 times |
Mon 30 June 2025 |
0.88 (-1.12%) |
0.85 |
0.84 - 1.03 |
0.9518 times |
Fri 30 May 2025 |
0.89 (0%) |
0.85 |
0.76 - 0.95 |
0.6885 times |
Wed 30 April 2025 |
0.89 (3.49%) |
0.82 |
0.82 - 1.02 |
0.7224 times |
Fri 28 March 2025 |
0.86 (-13.13%) |
0.99 |
0.85 - 1.03 |
1.2356 times |
Fri 28 February 2025 |
0.99 (4.21%) |
0.91 |
0.81 - 1.15 |
1.6514 times |
Mon 27 January 2025 |
0.95 (-16.67%) |
1.09 |
0.95 - 1.09 |
0.0619 times |
Mon 30 December 2024 |
1.14 (14%) |
1.00 |
0.95 - 1.32 |
1.098 times |
DMA SMA EMA moving averages of Goenka Diam 533189
DMA (daily moving average) of Goenka Diam 533189
| DMA period | DMA value | | 5 day DMA | 1.24 | | 12 day DMA | 1.12 | | 20 day DMA | 1.06 | | 35 day DMA | 1.02 | | 50 day DMA | 0.98 | | 100 day DMA | 0.94 | | 150 day DMA | 0.93 | | 200 day DMA | 0.96 | EMA (exponential moving average) of Goenka Diam 533189
| EMA period | EMA current | EMA prev | EMA prev2 | | 5 day EMA | 1.26 | 1.21 | 1.16 | | 12 day EMA | 1.16 | 1.13 | 1.1 | | 20 day EMA | 1.1 | 1.07 | 1.05 | | 35 day EMA | 1.04 | 1.02 | 1 | | 50 day EMA | 0.99 | 0.98 | 0.97 |
SMA (simple moving average) of Goenka Diam 533189
| SMA period | SMA current | SMA prev | SMA prev2 | | 5 day SMA | 1.24 | 1.19 | 1.15 | | 12 day SMA | 1.12 | 1.09 | 1.06 | | 20 day SMA | 1.06 | 1.05 | 1.03 | | 35 day SMA | 1.02 | 1.01 | 1 | | 50 day SMA | 0.98 | 0.97 | 0.96 | | 100 day SMA | 0.94 | 0.94 | 0.94 | | 150 day SMA | 0.93 | 0.93 | 0.93 | | 200 day SMA | 0.96 | 0.96 | 0.96 |
|
|
