ManInfra 533169 full analysis,charts,indicators,moving averages,SMA,DMA,EMA,ADX,MACD,RSIMan Infra 533169 WideScreen charts, DMA,SMA,EMA technical analysis, forecast prediction, by indicators ADX,MACD,RSI,CCI BSE stock exchange
Daily price and charts and targets ManInfra Strong Daily Stock price targets for ManInfra 533169 are 161.55 and 164.6 | Daily Target 1 | 159.17 | | Daily Target 2 | 160.88 | | Daily Target 3 | 162.21666666667 | | Daily Target 4 | 163.93 | | Daily Target 5 | 165.27 |
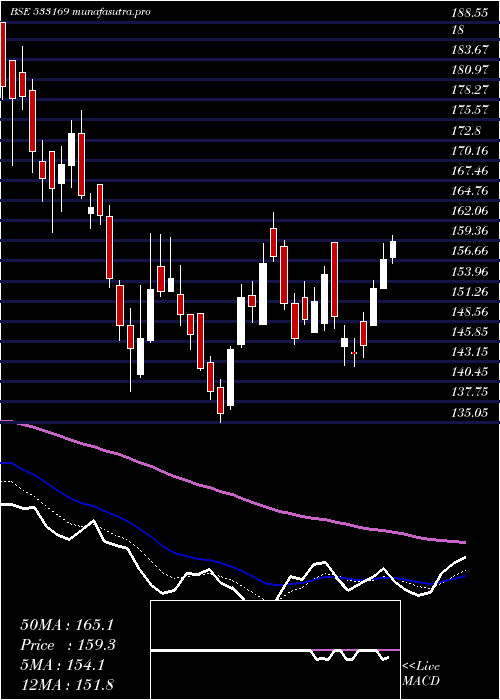
Daily price and volume Man Infra
| Date |
Closing |
Open |
Range |
Volume |
Wed 03 September 2025 |
162.60 (1.25%) |
161.00 |
160.50 - 163.55 |
4.7896 times |
Tue 02 September 2025 |
160.60 (0.69%) |
160.00 |
159.20 - 163.15 |
0.3985 times |
Mon 01 September 2025 |
159.50 (1.33%) |
157.65 |
157.60 - 160.15 |
0.3177 times |
Fri 29 August 2025 |
157.40 (-2.27%) |
160.45 |
157.15 - 161.25 |
0.6437 times |
Thu 28 August 2025 |
161.05 (-1.62%) |
163.35 |
160.05 - 164.00 |
0.3567 times |
Tue 26 August 2025 |
163.70 (-0.06%) |
163.50 |
160.80 - 164.75 |
0.4686 times |
Mon 25 August 2025 |
163.80 (-1%) |
168.85 |
163.25 - 168.85 |
0.4683 times |
Fri 22 August 2025 |
165.45 (-1.28%) |
167.55 |
165.15 - 168.35 |
0.5195 times |
Thu 21 August 2025 |
167.60 (2.44%) |
165.10 |
163.90 - 169.60 |
1.4322 times |
Wed 20 August 2025 |
163.60 (3.32%) |
159.00 |
158.90 - 164.55 |
0.6052 times |
Tue 19 August 2025 |
158.35 (-0.5%) |
161.85 |
157.50 - 161.85 |
0.4497 times |
Weekly price and charts ManInfra Strong weekly Stock price targets for ManInfra 533169 are 160.1 and 166.05 | Weekly Target 1 | 155.3 | | Weekly Target 2 | 158.95 | | Weekly Target 3 | 161.25 | | Weekly Target 4 | 164.9 | | Weekly Target 5 | 167.2 |
Weekly price and volumes for Man Infra
| Date |
Closing |
Open |
Range |
Volume |
Wed 03 September 2025 |
162.60 (3.3%) |
157.65 |
157.60 - 163.55 |
1.4273 times |
Fri 29 August 2025 |
157.40 (-4.87%) |
168.85 |
157.15 - 168.85 |
0.5022 times |
Fri 22 August 2025 |
165.45 (6.13%) |
157.00 |
155.70 - 169.60 |
0.9602 times |
Thu 14 August 2025 |
155.90 (-6.08%) |
165.50 |
153.50 - 167.95 |
0.6321 times |
Fri 08 August 2025 |
166.00 (-3.52%) |
169.15 |
164.25 - 174.00 |
0.566 times |
Fri 01 August 2025 |
172.05 (-1.71%) |
177.80 |
171.10 - 184.60 |
1.1103 times |
Fri 25 July 2025 |
175.05 (-2.72%) |
181.80 |
174.50 - 187.30 |
1.0896 times |
Fri 18 July 2025 |
179.95 (-1.18%) |
183.65 |
177.35 - 184.25 |
0.8008 times |
Fri 11 July 2025 |
182.10 (-3.19%) |
191.90 |
180.55 - 191.90 |
0.9995 times |
Fri 04 July 2025 |
188.10 (2.06%) |
184.30 |
178.25 - 190.50 |
1.9118 times |
Fri 27 June 2025 |
184.30 (17.09%) |
160.55 |
158.75 - 187.20 |
2.9894 times |

Monthly price and charts ManInfra Strong monthly Stock price targets for ManInfra 533169 are 160.1 and 166.05 | Monthly Target 1 | 155.3 | | Monthly Target 2 | 158.95 | | Monthly Target 3 | 161.25 | | Monthly Target 4 | 164.9 | | Monthly Target 5 | 167.2 |
Monthly price and volumes Man Infra
| Date |
Closing |
Open |
Range |
Volume |
Wed 03 September 2025 |
162.60 (3.3%) |
157.65 |
157.60 - 163.55 |
0.2235 times |
Fri 29 August 2025 |
157.40 (-9.75%) |
174.35 |
153.50 - 175.55 |
0.4543 times |
Thu 31 July 2025 |
174.40 (-3.73%) |
181.95 |
173.80 - 191.90 |
0.783 times |
Mon 30 June 2025 |
181.15 (10.42%) |
165.15 |
156.60 - 188.45 |
1.2998 times |
Fri 30 May 2025 |
164.05 (7.08%) |
152.05 |
143.70 - 172.00 |
0.9242 times |
Wed 30 April 2025 |
153.20 (2.96%) |
147.05 |
142.45 - 167.90 |
0.6589 times |
Fri 28 March 2025 |
148.80 (0.54%) |
148.00 |
135.05 - 163.15 |
1.322 times |
Fri 28 February 2025 |
148.00 (-26.55%) |
205.80 |
146.00 - 205.80 |
0.7177 times |
Fri 31 January 2025 |
201.50 (-18.09%) |
244.05 |
181.85 - 258.00 |
1.382 times |
Tue 31 December 2024 |
246.00 (4.86%) |
235.45 |
224.85 - 262.50 |
2.2348 times |
Fri 29 November 2024 |
234.60 (20.18%) |
195.80 |
169.05 - 237.00 |
1.2746 times |

DMA SMA EMA moving averages of Man Infra 533169
DMA (daily moving average) of Man Infra 533169
| DMA period | DMA value | | 5 day DMA | 160.23 | | 12 day DMA | 161.9 | | 20 day DMA | 163.07 | | 35 day DMA | 169.78 | | 50 day DMA | 173.74 | | 100 day DMA | 167.13 | | 150 day DMA | 168.89 | | 200 day DMA | 182.24 | EMA (exponential moving average) of Man Infra 533169
| EMA period | EMA current | EMA prev | EMA prev2 | | 5 day EMA | 161.25 | 160.57 | 160.56 | | 12 day EMA | 162.28 | 162.22 | 162.52 | | 20 day EMA | 164.21 | 164.38 | 164.78 | | 35 day EMA | 167.49 | 167.78 | 168.2 | | 50 day EMA | 171.46 | 171.82 | 172.28 |
SMA (simple moving average) of Man Infra 533169
| SMA period | SMA current | SMA prev | SMA prev2 | | 5 day SMA | 160.23 | 160.45 | 161.09 | | 12 day SMA | 161.9 | 161.34 | 161.47 | | 20 day SMA | 163.07 | 163.52 | 164.09 | | 35 day SMA | 169.78 | 170.27 | 170.89 | | 50 day SMA | 173.74 | 173.7 | 173.64 | | 100 day SMA | 167.13 | 167.05 | 166.96 | | 150 day SMA | 168.89 | 169.32 | 169.71 | | 200 day SMA | 182.24 | 182.39 | 182.57 |
|
|
