RossellInd 533168 full analysis,charts,indicators,moving averages,SMA,DMA,EMA,ADX,MACD,RSIRossell Ind 533168 WideScreen charts, DMA,SMA,EMA technical analysis, forecast prediction, by indicators ADX,MACD,RSI,CCI BSE stock exchange
Daily price and charts and targets RossellInd Strong Daily Stock price targets for RossellInd 533168 are 74.84 and 79.72 | Daily Target 1 | 71.35 | | Daily Target 2 | 73.45 | | Daily Target 3 | 76.226666666667 | | Daily Target 4 | 78.33 | | Daily Target 5 | 81.11 |
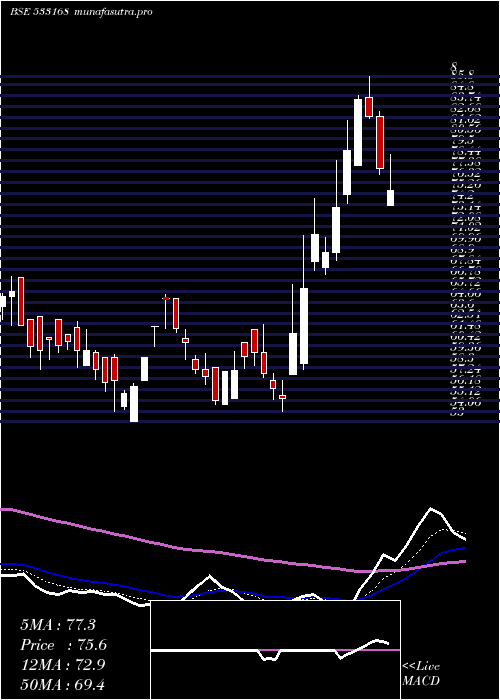
Daily price and volume Rossell Ind
| Date |
Closing |
Open |
Range |
Volume |
Mon 21 April 2025 |
75.56 (-2.75%) |
74.12 |
74.12 - 79.00 |
0.1715 times |
Thu 17 April 2025 |
77.70 (-6.06%) |
82.75 |
77.10 - 83.26 |
0.2809 times |
Wed 16 April 2025 |
82.71 (-1.97%) |
84.56 |
82.51 - 86.65 |
0.3015 times |
Tue 15 April 2025 |
84.37 (6.21%) |
78.00 |
78.00 - 84.80 |
0.7184 times |
Fri 11 April 2025 |
79.44 (7.53%) |
75.11 |
74.25 - 82.40 |
0.9311 times |
Wed 09 April 2025 |
73.88 (6.33%) |
69.48 |
68.73 - 78.49 |
1.2083 times |
Tue 08 April 2025 |
69.48 (-2.46%) |
68.06 |
67.31 - 71.00 |
0.3008 times |
Fri 04 April 2025 |
71.23 (7.97%) |
68.58 |
67.70 - 74.75 |
0.732 times |
Wed 02 April 2025 |
65.97 (7.15%) |
58.64 |
58.06 - 71.15 |
0.8889 times |
Tue 01 April 2025 |
61.57 (11.3%) |
57.65 |
57.65 - 66.38 |
4.4668 times |
Fri 28 March 2025 |
55.32 (-1.65%) |
55.60 |
54.00 - 56.99 |
0.0368 times |
Weekly price and charts RossellInd Strong weekly Stock price targets for RossellInd 533168 are 74.84 and 79.72 | Weekly Target 1 | 71.35 | | Weekly Target 2 | 73.45 | | Weekly Target 3 | 76.226666666667 | | Weekly Target 4 | 78.33 | | Weekly Target 5 | 81.11 |
Weekly price and volumes for Rossell Ind
| Date |
Closing |
Open |
Range |
Volume |
Mon 21 April 2025 |
75.56 (-2.75%) |
74.12 |
74.12 - 79.00 |
0.1272 times |
Thu 17 April 2025 |
77.70 (-2.19%) |
78.00 |
77.10 - 86.65 |
0.9653 times |
Fri 11 April 2025 |
79.44 (11.53%) |
68.06 |
67.31 - 82.40 |
1.8109 times |
Fri 04 April 2025 |
71.23 (28.76%) |
57.65 |
57.65 - 74.75 |
4.5178 times |
Fri 28 March 2025 |
55.32 (-6.82%) |
62.00 |
54.00 - 62.50 |
0.2374 times |
Fri 21 March 2025 |
59.37 (2.24%) |
58.07 |
54.66 - 60.78 |
0.4902 times |
Thu 13 March 2025 |
58.07 (-6.73%) |
65.00 |
57.73 - 65.37 |
0.7333 times |
Fri 07 March 2025 |
62.26 (9.52%) |
59.26 |
53.00 - 62.26 |
0.7101 times |
Fri 28 February 2025 |
56.85 (-6.5%) |
62.20 |
56.00 - 62.75 |
0.1794 times |
Fri 21 February 2025 |
60.80 (-2.61%) |
63.00 |
58.10 - 63.30 |
0.2283 times |
Fri 14 February 2025 |
62.43 (-9.21%) |
68.70 |
62.36 - 71.90 |
0.2931 times |

Monthly price and charts RossellInd Strong monthly Stock price targets for RossellInd 533168 are 66.61 and 95.61 | Monthly Target 1 | 44.29 | | Monthly Target 2 | 59.92 | | Monthly Target 3 | 73.286666666667 | | Monthly Target 4 | 88.92 | | Monthly Target 5 | 102.29 |
Monthly price and volumes Rossell Ind
| Date |
Closing |
Open |
Range |
Volume |
Mon 21 April 2025 |
75.56 (36.59%) |
57.65 |
57.65 - 86.65 |
1.9697 times |
Fri 28 March 2025 |
55.32 (-2.69%) |
59.26 |
53.00 - 65.37 |
0.5762 times |
Fri 28 February 2025 |
56.85 (-17.86%) |
71.99 |
56.00 - 71.99 |
0.2544 times |
Fri 31 January 2025 |
69.21 (-7.26%) |
77.00 |
65.28 - 82.21 |
0.4518 times |
Tue 31 December 2024 |
74.63 (-11.74%) |
86.25 |
73.10 - 98.00 |
0.8573 times |
Fri 29 November 2024 |
84.56 (-1.67%) |
90.30 |
76.61 - 94.81 |
0.4037 times |
Thu 31 October 2024 |
86.00 (-29.71%) |
116.25 |
70.65 - 122.05 |
3.2361 times |
Mon 30 September 2024 |
122.35 (-78.44%) |
572.70 |
122.35 - 640.50 |
0.8667 times |
Fri 30 August 2024 |
567.60 (-5.94%) |
601.30 |
547.20 - 630.00 |
0.3241 times |
Wed 31 July 2024 |
603.45 (6.08%) |
570.95 |
548.55 - 665.00 |
1.0601 times |
Fri 28 June 2024 |
568.85 (27.96%) |
450.25 |
368.40 - 599.80 |
1.2686 times |

DMA SMA EMA moving averages of Rossell Ind 533168
DMA (daily moving average) of Rossell Ind 533168
| DMA period | DMA value | | 5 day DMA | 79.96 | | 12 day DMA | 71.12 | | 20 day DMA | 65.84 | | 35 day DMA | 63.22 | | 50 day DMA | 64.31 | | 100 day DMA | 71.32 | | 150 day DMA | 119.37 | | 200 day DMA | 234.54 | EMA (exponential moving average) of Rossell Ind 533168
| EMA period | EMA current | EMA prev | EMA prev2 | | 5 day EMA | 77.31 | 78.19 | 78.44 | | 12 day EMA | 72.91 | 72.43 | 71.47 | | 20 day EMA | 69.5 | 68.86 | 67.93 | | 35 day EMA | 67.26 | 66.77 | 66.13 | | 50 day EMA | 66.28 | 65.9 | 65.42 |
SMA (simple moving average) of Rossell Ind 533168
| SMA period | SMA current | SMA prev | SMA prev2 | | 5 day SMA | 79.96 | 79.62 | 77.98 | | 12 day SMA | 71.12 | 69.64 | 68.14 | | 20 day SMA | 65.84 | 65.1 | 64.32 | | 35 day SMA | 63.22 | 62.78 | 62.28 | | 50 day SMA | 64.31 | 64.14 | 63.96 | | 100 day SMA | 71.32 | 71.39 | 71.46 | | 150 day SMA | 119.37 | 122.67 | 126.1 | | 200 day SMA | 234.54 | 236.51 | 238.52 |
|
|
