Wabco 533023 full analysis,charts,indicators,moving averages,SMA,DMA,EMA,ADX,MACD,RSIWabco 533023 WideScreen charts, DMA,SMA,EMA technical analysis, forecast prediction, by indicators ADX,MACD,RSI,CCI BSE stock exchange
Daily price and charts and targets Wabco Strong Daily Stock price targets for Wabco 533023 are 12918.1 and 13044 | Daily Target 1 | 12894.8 | | Daily Target 2 | 12941.4 | | Daily Target 3 | 13020.7 | | Daily Target 4 | 13067.3 | | Daily Target 5 | 13146.6 |
Daily price and volume Wabco
| Date |
Closing |
Open |
Range |
Volume |
Thu 23 October 2025 |
12988.00 (-0.68%) |
13086.05 |
12974.10 - 13100.00 |
0.6945 times |
Tue 21 October 2025 |
13076.55 (0.2%) |
13091.00 |
12991.05 - 13143.95 |
0.3237 times |
Mon 20 October 2025 |
13050.00 (0.39%) |
13031.05 |
12943.00 - 13125.50 |
0.3649 times |
Fri 17 October 2025 |
12998.75 (-0.38%) |
13003.00 |
12825.00 - 13117.30 |
1.236 times |
Thu 16 October 2025 |
13048.50 (0.2%) |
13042.00 |
12952.15 - 13137.25 |
0.724 times |
Wed 15 October 2025 |
13022.30 (-0.07%) |
13075.05 |
12989.80 - 13122.40 |
1.03 times |
Tue 14 October 2025 |
13031.35 (-0.82%) |
13068.65 |
12976.25 - 13125.00 |
2.2366 times |
Mon 13 October 2025 |
13138.65 (-1.07%) |
13236.15 |
13040.00 - 13236.15 |
1.0948 times |
Fri 10 October 2025 |
13280.35 (-0.42%) |
13391.00 |
13215.00 - 13472.90 |
1.5362 times |
Thu 09 October 2025 |
13336.15 (0.67%) |
13275.70 |
13275.65 - 13448.00 |
0.7593 times |
Wed 08 October 2025 |
13246.85 (-2.18%) |
13542.00 |
13174.75 - 13542.00 |
1.3714 times |
Weekly price and charts Wabco Strong weekly Stock price targets for Wabco 533023 are 12865.03 and 13065.98 | Weekly Target 1 | 12824.03 | | Weekly Target 2 | 12906.02 | | Weekly Target 3 | 13024.983333333 | | Weekly Target 4 | 13106.97 | | Weekly Target 5 | 13225.93 |
Weekly price and volumes for Wabco
| Date |
Closing |
Open |
Range |
Volume |
Thu 23 October 2025 |
12988.00 (-0.08%) |
13031.05 |
12943.00 - 13143.95 |
0.0974 times |
Fri 17 October 2025 |
12998.75 (-2.12%) |
13236.15 |
12825.00 - 13236.15 |
0.4451 times |
Fri 10 October 2025 |
13280.35 (-2.19%) |
13544.00 |
13174.75 - 13634.95 |
0.5375 times |
Fri 03 October 2025 |
13578.20 (8.07%) |
12600.00 |
12355.00 - 13880.00 |
1.4608 times |
Fri 26 September 2025 |
12564.75 (-5.03%) |
13209.90 |
12540.95 - 13397.90 |
1.2801 times |
Fri 19 September 2025 |
13229.90 (-1.26%) |
13600.05 |
13207.95 - 13810.05 |
0.4426 times |
Fri 12 September 2025 |
13398.55 (-0.97%) |
13569.00 |
13323.10 - 13850.00 |
0.4069 times |
Fri 05 September 2025 |
13530.40 (-3.79%) |
14164.10 |
13465.00 - 14315.45 |
0.4148 times |
Fri 29 August 2025 |
14063.20 (-3.45%) |
14565.95 |
13990.00 - 15058.35 |
3.4843 times |
Fri 22 August 2025 |
14565.95 (5.86%) |
13759.10 |
13605.00 - 14742.95 |
1.4305 times |
Thu 14 August 2025 |
13759.10 (3.4%) |
13247.00 |
13135.10 - 14371.75 |
0.789 times |

Monthly price and charts Wabco Strong monthly Stock price targets for Wabco 533023 are 12379 and 13434 | Monthly Target 1 | 12176 | | Monthly Target 2 | 12582 | | Monthly Target 3 | 13231 | | Monthly Target 4 | 13637 | | Monthly Target 5 | 14286 |
Monthly price and volumes Wabco
| Date |
Closing |
Open |
Range |
Volume |
Thu 23 October 2025 |
12988.00 (0.7%) |
13350.95 |
12825.00 - 13880.00 |
0.4901 times |
Tue 30 September 2025 |
12898.35 (-8.28%) |
14164.10 |
12355.00 - 14315.45 |
0.6035 times |
Fri 29 August 2025 |
14063.20 (6.6%) |
13243.05 |
12857.05 - 15058.35 |
1.5099 times |
Thu 31 July 2025 |
13191.90 (-1.56%) |
13025.05 |
11811.00 - 14192.40 |
0.6984 times |
Mon 30 June 2025 |
13401.20 (0.2%) |
13125.05 |
12600.00 - 14850.00 |
1.4422 times |
Fri 30 May 2025 |
13374.10 (6.75%) |
12500.60 |
11552.05 - 13813.55 |
0.643 times |
Wed 30 April 2025 |
12528.95 (-3.57%) |
12900.10 |
12022.00 - 13652.00 |
0.7582 times |
Fri 28 March 2025 |
12992.20 (18.72%) |
10795.40 |
10476.95 - 13538.50 |
1.0828 times |
Fri 28 February 2025 |
10943.20 (-0.58%) |
10900.00 |
9911.50 - 11980.00 |
1.3845 times |
Fri 31 January 2025 |
11007.05 (-8.57%) |
12052.55 |
9566.75 - 12097.55 |
1.3873 times |
Tue 31 December 2024 |
12038.20 (-3.55%) |
12628.95 |
11340.90 - 12628.95 |
1.4525 times |

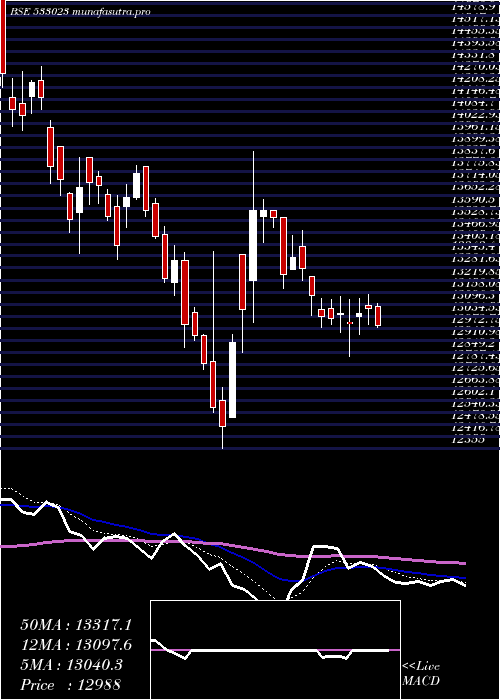
DMA SMA EMA moving averages of Wabco 533023
DMA (daily moving average) of Wabco 533023
| DMA period | DMA value | | 5 day DMA | 13032.36 | | 12 day DMA | 13146.6 | | 20 day DMA | 13082.11 | | 35 day DMA | 13278.92 | | 50 day DMA | 13549.09 | | 100 day DMA | 13436.1 | | 150 day DMA | 13163.59 | | 200 day DMA | 12646.14 | EMA (exponential moving average) of Wabco 533023
| EMA period | EMA current | EMA prev | EMA prev2 | | 5 day EMA | 13040.26 | 13066.38 | 13061.3 | | 12 day EMA | 13097.55 | 13117.46 | 13124.89 | | 20 day EMA | 13160.68 | 13178.85 | 13189.61 | | 35 day EMA | 13320.56 | 13340.14 | 13355.66 | | 50 day EMA | 13490.77 | 13511.28 | 13529.02 |
SMA (simple moving average) of Wabco 533023
| SMA period | SMA current | SMA prev | SMA prev2 | | 5 day SMA | 13032.36 | 13039.22 | 13030.18 | | 12 day SMA | 13146.6 | 13195.87 | 13237.68 | | 20 day SMA | 13082.11 | 13082.19 | 13094.5 | | 35 day SMA | 13278.92 | 13312.42 | 13345.55 | | 50 day SMA | 13549.09 | 13555.47 | 13561.38 | | 100 day SMA | 13436.1 | 13433.44 | 13430.55 | | 150 day SMA | 13163.59 | 13151.95 | 13137.71 | | 200 day SMA | 12646.14 | 12639.33 | 12632.32 |
|
|
