JaibalaInd 532976 full analysis,charts,indicators,moving averages,SMA,DMA,EMA,ADX,MACD,RSIJaibala Ind 532976 WideScreen charts, DMA,SMA,EMA technical analysis, forecast prediction, by indicators ADX,MACD,RSI,CCI BSE stock exchange
Daily price and charts and targets JaibalaInd Strong Daily Stock price targets for JaibalaInd 532976 are 94.13 and 97.22 | Daily Target 1 | 91.69 | | Daily Target 2 | 93.48 | | Daily Target 3 | 94.783333333333 | | Daily Target 4 | 96.57 | | Daily Target 5 | 97.87 |
Daily price and volume Jaibala Ind
| Date |
Closing |
Open |
Range |
Volume |
Tue 21 October 2025 |
95.26 (0.58%) |
95.00 |
93.00 - 96.09 |
1.0385 times |
Mon 20 October 2025 |
94.71 (0.99%) |
93.21 |
93.20 - 95.00 |
0.9816 times |
Fri 17 October 2025 |
93.78 (-1.86%) |
97.99 |
93.53 - 97.99 |
0.6323 times |
Thu 16 October 2025 |
95.56 (-0.63%) |
96.29 |
95.17 - 96.74 |
0.6963 times |
Wed 15 October 2025 |
96.17 (2.2%) |
94.00 |
94.00 - 97.75 |
1.1991 times |
Tue 14 October 2025 |
94.10 (-1.99%) |
96.01 |
91.69 - 96.53 |
2.2885 times |
Mon 13 October 2025 |
96.01 (-2.11%) |
96.66 |
95.00 - 97.48 |
1.3382 times |
Fri 10 October 2025 |
98.08 (-0.1%) |
99.99 |
97.51 - 99.99 |
0.9215 times |
Thu 09 October 2025 |
98.18 (0.41%) |
98.10 |
97.05 - 98.64 |
0.4296 times |
Wed 08 October 2025 |
97.78 (-1.14%) |
91.00 |
90.26 - 98.60 |
0.4743 times |
Tue 07 October 2025 |
98.91 (0.17%) |
98.25 |
97.86 - 99.55 |
0.9629 times |
Weekly price and charts JaibalaInd Strong weekly Stock price targets for JaibalaInd 532976 are 94.13 and 97.22 | Weekly Target 1 | 91.69 | | Weekly Target 2 | 93.48 | | Weekly Target 3 | 94.783333333333 | | Weekly Target 4 | 96.57 | | Weekly Target 5 | 97.87 |
Weekly price and volumes for Jaibala Ind
| Date |
Closing |
Open |
Range |
Volume |
Tue 21 October 2025 |
95.26 (1.58%) |
93.21 |
93.00 - 96.09 |
0.2895 times |
Fri 17 October 2025 |
93.78 (-4.38%) |
96.66 |
91.69 - 97.99 |
0.882 times |
Fri 10 October 2025 |
98.08 (-2.27%) |
99.11 |
90.26 - 100.60 |
0.5673 times |
Fri 03 October 2025 |
100.36 (5.2%) |
95.45 |
94.15 - 101.99 |
0.9268 times |
Fri 26 September 2025 |
95.40 (-5.68%) |
101.00 |
93.25 - 102.70 |
1.5357 times |
Fri 19 September 2025 |
101.15 (0.95%) |
100.50 |
99.65 - 108.15 |
2.6627 times |
Fri 12 September 2025 |
100.20 (-1.86%) |
102.20 |
99.60 - 103.45 |
1.1087 times |
Fri 05 September 2025 |
102.10 (-1.16%) |
101.70 |
100.80 - 106.15 |
0.7546 times |
Fri 29 August 2025 |
103.30 (0.39%) |
106.00 |
99.65 - 106.00 |
0.5173 times |
Fri 22 August 2025 |
102.90 (1.63%) |
105.55 |
101.10 - 109.45 |
0.7554 times |
Thu 14 August 2025 |
101.25 (-6.64%) |
108.85 |
100.25 - 113.80 |
0.3128 times |
Monthly price and charts JaibalaInd Strong monthly Stock price targets for JaibalaInd 532976 are 92.76 and 104.49 | Monthly Target 1 | 84.11 | | Monthly Target 2 | 89.68 | | Monthly Target 3 | 95.836666666667 | | Monthly Target 4 | 101.41 | | Monthly Target 5 | 107.57 |
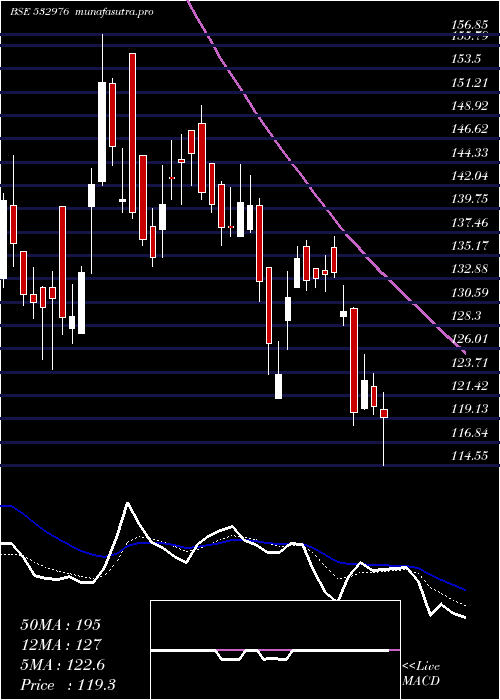
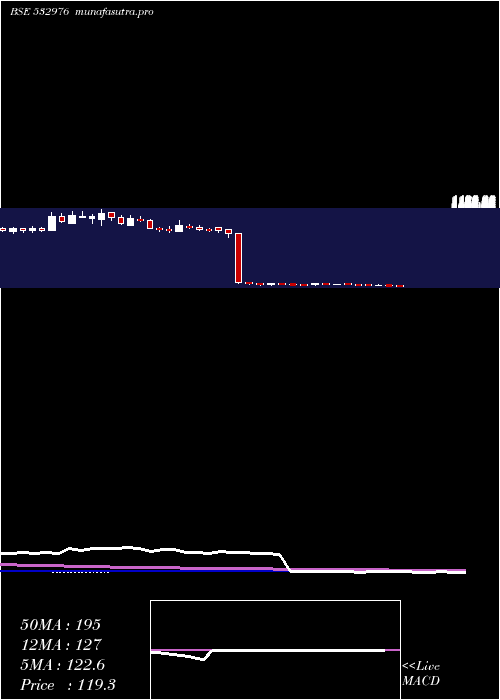
Monthly price and volumes Jaibala Ind
| Date |
Closing |
Open |
Range |
Volume |
Tue 21 October 2025 |
95.26 (0.8%) |
94.60 |
90.26 - 101.99 |
0.5937 times |
Tue 30 September 2025 |
94.50 (-8.52%) |
101.70 |
93.25 - 108.15 |
1.606 times |
Fri 29 August 2025 |
103.30 (-7.97%) |
112.70 |
99.65 - 114.35 |
0.5279 times |
Thu 31 July 2025 |
112.25 (-13.92%) |
130.95 |
109.45 - 131.00 |
1.4426 times |
Mon 30 June 2025 |
130.40 (24.19%) |
105.00 |
99.25 - 139.00 |
3.7064 times |
Fri 30 May 2025 |
105.00 (-11.99%) |
118.50 |
103.90 - 121.90 |
0.7165 times |
Wed 30 April 2025 |
119.30 (-13.52%) |
137.00 |
114.55 - 144.10 |
0.2248 times |
Fri 28 March 2025 |
137.95 (5.35%) |
139.95 |
126.55 - 156.85 |
0.3565 times |
Fri 28 February 2025 |
130.95 (-3.54%) |
136.30 |
124.00 - 161.00 |
0.6139 times |
Fri 31 January 2025 |
135.75 (-84.89%) |
899.90 |
128.45 - 929.85 |
0.2115 times |
Tue 31 December 2024 |
898.50 (-0.87%) |
895.05 |
877.75 - 1047.60 |
0.1753 times |

DMA SMA EMA moving averages of Jaibala Ind 532976
DMA (daily moving average) of Jaibala Ind 532976
| DMA period | DMA value | | 5 day DMA | 95.1 | | 12 day DMA | 96.44 | | 20 day DMA | 96.78 | | 35 day DMA | 98.8 | | 50 day DMA | 100.2 | | 100 day DMA | 107.28 | | 150 day DMA | 113.55 | | 200 day DMA | 182.36 | EMA (exponential moving average) of Jaibala Ind 532976
| EMA period | EMA current | EMA prev | EMA prev2 | | 5 day EMA | 95.15 | 95.1 | 95.29 | | 12 day EMA | 96.06 | 96.21 | 96.48 | | 20 day EMA | 97.04 | 97.23 | 97.49 | | 35 day EMA | 98.74 | 98.94 | 99.19 | | 50 day EMA | 100.51 | 100.72 | 100.96 |
SMA (simple moving average) of Jaibala Ind 532976
| SMA period | SMA current | SMA prev | SMA prev2 | | 5 day SMA | 95.1 | 94.86 | 95.12 | | 12 day SMA | 96.44 | 96.87 | 97.19 | | 20 day SMA | 96.78 | 97.02 | 97.34 | | 35 day SMA | 98.8 | 99 | 99.25 | | 50 day SMA | 100.2 | 100.54 | 100.8 | | 100 day SMA | 107.28 | 107.38 | 107.51 | | 150 day SMA | 113.55 | 113.81 | 114.04 | | 200 day SMA | 182.36 | 186.38 | 190.5 |
|
|
