TitagarhWag 532966 full analysis,charts,indicators,moving averages,SMA,DMA,EMA,ADX,MACD,RSITitagarh Wag 532966 WideScreen charts, DMA,SMA,EMA technical analysis, forecast prediction, by indicators ADX,MACD,RSI,CCI BSE stock exchange
Daily price and charts and targets TitagarhWag Strong Daily Stock price targets for TitagarhWag 532966 are 776.23 and 793.48 | Daily Target 1 | 771.98 | | Daily Target 2 | 780.47 | | Daily Target 3 | 789.23333333333 | | Daily Target 4 | 797.72 | | Daily Target 5 | 806.48 |
Daily price and volume Titagarh Wag
| Date |
Closing |
Open |
Range |
Volume |
Fri 05 December 2025 |
788.95 (0.01%) |
789.15 |
780.75 - 798.00 |
1.1347 times |
Thu 04 December 2025 |
788.90 (-0.67%) |
792.20 |
782.50 - 802.00 |
1.0808 times |
Wed 03 December 2025 |
794.20 (-1.76%) |
810.10 |
789.45 - 815.65 |
1.2663 times |
Tue 02 December 2025 |
808.40 (-1.79%) |
822.15 |
806.00 - 824.95 |
1.2213 times |
Mon 01 December 2025 |
823.15 (-0.43%) |
829.55 |
821.00 - 849.80 |
1.053 times |
Fri 28 November 2025 |
826.70 (-1.36%) |
838.45 |
821.40 - 840.00 |
1.0396 times |
Thu 27 November 2025 |
838.10 (-1.09%) |
858.80 |
835.90 - 866.00 |
0.5756 times |
Wed 26 November 2025 |
847.35 (1.2%) |
839.85 |
833.00 - 850.70 |
0.9046 times |
Tue 25 November 2025 |
837.30 (-0.85%) |
841.10 |
835.00 - 848.25 |
0.8039 times |
Mon 24 November 2025 |
844.45 (-0.68%) |
854.05 |
841.00 - 859.80 |
0.9202 times |
Fri 21 November 2025 |
850.20 (-1.78%) |
860.50 |
848.00 - 868.55 |
0.5613 times |

Weekly price and charts TitagarhWag Strong weekly Stock price targets for TitagarhWag 532966 are 750.33 and 819.38 | Weekly Target 1 | 737.45 | | Weekly Target 2 | 763.2 | | Weekly Target 3 | 806.5 | | Weekly Target 4 | 832.25 | | Weekly Target 5 | 875.55 |
Weekly price and volumes for Titagarh Wag
| Date |
Closing |
Open |
Range |
Volume |
Fri 05 December 2025 |
788.95 (-4.57%) |
829.55 |
780.75 - 849.80 |
1.1667 times |
Fri 28 November 2025 |
826.70 (-2.76%) |
854.05 |
821.40 - 866.00 |
0.8602 times |
Fri 21 November 2025 |
850.20 (-1.96%) |
869.95 |
848.00 - 901.10 |
0.9917 times |
Fri 14 November 2025 |
867.20 (2.84%) |
847.15 |
837.00 - 891.95 |
1.003 times |
Fri 07 November 2025 |
843.25 (-4.67%) |
895.65 |
830.95 - 919.00 |
1.1282 times |
Fri 31 October 2025 |
884.55 (0.62%) |
875.10 |
872.00 - 913.65 |
0.9907 times |
Thu 23 October 2025 |
879.10 (1.42%) |
867.65 |
866.00 - 892.45 |
0.308 times |
Fri 17 October 2025 |
866.80 (-3.72%) |
890.20 |
861.55 - 902.55 |
1.1301 times |
Fri 10 October 2025 |
900.25 (1.49%) |
887.55 |
877.55 - 933.95 |
1.6373 times |
Fri 03 October 2025 |
887.00 (0.82%) |
880.20 |
864.10 - 901.20 |
0.784 times |
Fri 26 September 2025 |
879.75 (-7.83%) |
952.55 |
875.00 - 956.00 |
1.0552 times |
Monthly price and charts TitagarhWag Strong monthly Stock price targets for TitagarhWag 532966 are 750.33 and 819.38 | Monthly Target 1 | 737.45 | | Monthly Target 2 | 763.2 | | Monthly Target 3 | 806.5 | | Monthly Target 4 | 832.25 | | Monthly Target 5 | 875.55 |
Monthly price and volumes Titagarh Wag
| Date |
Closing |
Open |
Range |
Volume |
Fri 05 December 2025 |
788.95 (-4.57%) |
829.55 |
780.75 - 849.80 |
0.1229 times |
Fri 28 November 2025 |
826.70 (-6.54%) |
895.65 |
821.40 - 919.00 |
0.4196 times |
Fri 31 October 2025 |
884.55 (1.38%) |
879.35 |
861.55 - 933.95 |
0.4633 times |
Tue 30 September 2025 |
872.55 (5.74%) |
833.00 |
828.75 - 964.90 |
0.6774 times |
Fri 29 August 2025 |
825.15 (-4.1%) |
863.60 |
770.00 - 884.90 |
1.0019 times |
Thu 31 July 2025 |
860.45 (-8.72%) |
943.05 |
822.60 - 969.95 |
0.8295 times |
Mon 30 June 2025 |
942.65 (5.73%) |
861.05 |
835.05 - 973.60 |
1.5534 times |
Fri 30 May 2025 |
891.60 (19.52%) |
746.00 |
667.85 - 974.05 |
2.7725 times |
Wed 30 April 2025 |
746.00 (-6.33%) |
795.00 |
731.15 - 829.90 |
0.7784 times |
Fri 28 March 2025 |
796.40 (14.22%) |
699.65 |
655.30 - 837.00 |
1.3811 times |
Fri 28 February 2025 |
697.25 (-31.64%) |
936.85 |
692.95 - 964.05 |
0.9066 times |
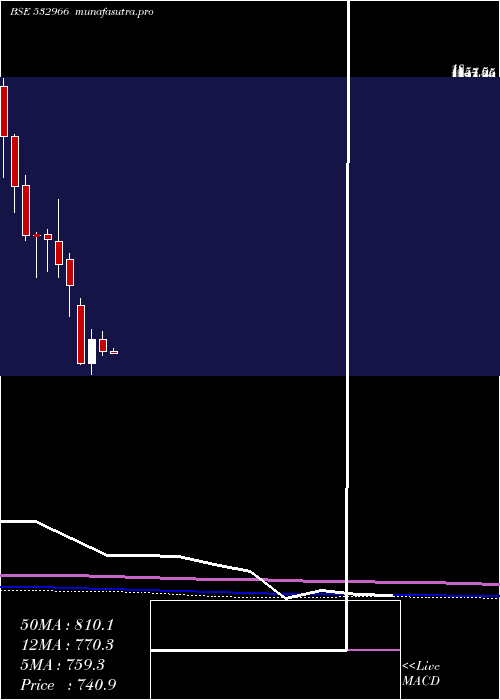
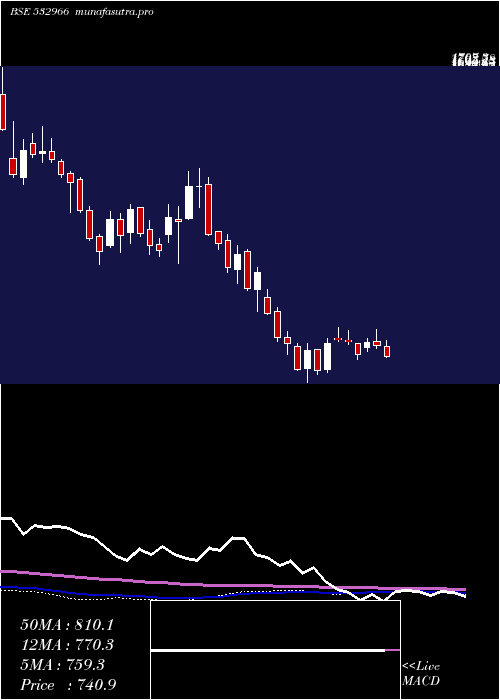
DMA SMA EMA moving averages of Titagarh Wag 532966
DMA (daily moving average) of Titagarh Wag 532966
| DMA period | DMA value | | 5 day DMA | 800.72 | | 12 day DMA | 826.11 | | 20 day DMA | 841.35 | | 35 day DMA | 860.37 | | 50 day DMA | 871.97 | | 100 day DMA | 874.51 | | 150 day DMA | 875.02 | | 200 day DMA | 851.08 | EMA (exponential moving average) of Titagarh Wag 532966
| EMA period | EMA current | EMA prev | EMA prev2 | | 5 day EMA | 800.51 | 806.29 | 814.99 | | 12 day EMA | 820.86 | 826.66 | 833.52 | | 20 day EMA | 835.83 | 840.76 | 846.22 | | 35 day EMA | 854.57 | 858.43 | 862.52 | | 50 day EMA | 870.81 | 874.15 | 877.63 |
SMA (simple moving average) of Titagarh Wag 532966
| SMA period | SMA current | SMA prev | SMA prev2 | | 5 day SMA | 800.72 | 808.27 | 818.11 | | 12 day SMA | 826.11 | 832.83 | 840.46 | | 20 day SMA | 841.35 | 844.67 | 849.18 | | 35 day SMA | 860.37 | 863.44 | 866.62 | | 50 day SMA | 871.97 | 875.28 | 878.43 | | 100 day SMA | 874.51 | 876.03 | 877.57 | | 150 day SMA | 875.02 | 874.94 | 874.87 | | 200 day SMA | 851.08 | 851.69 | 852.84 |
|
|
