CordsCable 532941 full analysis,charts,indicators,moving averages,SMA,DMA,EMA,ADX,MACD,RSICords Cable 532941 WideScreen charts, DMA,SMA,EMA technical analysis, forecast prediction, by indicators ADX,MACD,RSI,CCI BSE stock exchange
Daily price and charts and targets CordsCable Strong Daily Stock price targets for CordsCable 532941 are 176.08 and 181.18 | Daily Target 1 | 172 | | Daily Target 2 | 175.05 | | Daily Target 3 | 177.1 | | Daily Target 4 | 180.15 | | Daily Target 5 | 182.2 |
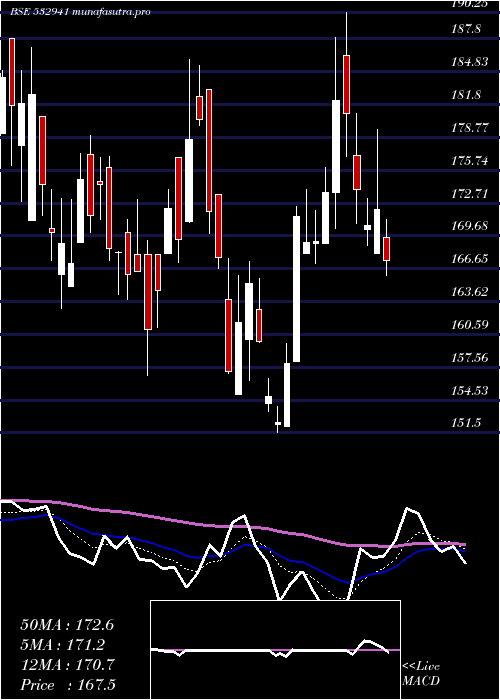
Daily price and volume Cords Cable
| Date |
Closing |
Open |
Range |
Volume |
Tue 02 September 2025 |
178.10 (2.03%) |
175.00 |
174.05 - 179.15 |
0.7963 times |
Mon 01 September 2025 |
174.55 (0.46%) |
171.15 |
170.70 - 176.50 |
0.4142 times |
Fri 29 August 2025 |
173.75 (-2.03%) |
178.00 |
173.05 - 179.15 |
2.4666 times |
Thu 28 August 2025 |
177.35 (-0.31%) |
177.65 |
177.00 - 180.50 |
1.2412 times |
Tue 26 August 2025 |
177.90 (-3.47%) |
186.65 |
177.30 - 186.65 |
1.2251 times |
Mon 25 August 2025 |
184.30 (1.6%) |
190.00 |
181.40 - 190.00 |
0.3504 times |
Fri 22 August 2025 |
181.40 (-1.84%) |
185.95 |
181.40 - 185.95 |
0.2732 times |
Thu 21 August 2025 |
184.80 (-0.11%) |
187.50 |
183.00 - 189.00 |
1.5137 times |
Wed 20 August 2025 |
185.00 (1.73%) |
183.60 |
180.30 - 188.85 |
1.0485 times |
Tue 19 August 2025 |
181.85 (1.91%) |
180.20 |
180.00 - 181.95 |
0.671 times |
Mon 18 August 2025 |
178.45 (-0.06%) |
179.40 |
175.75 - 179.40 |
0.829 times |
Weekly price and charts CordsCable Strong weekly Stock price targets for CordsCable 532941 are 174.4 and 182.85 | Weekly Target 1 | 167.53 | | Weekly Target 2 | 172.82 | | Weekly Target 3 | 175.98333333333 | | Weekly Target 4 | 181.27 | | Weekly Target 5 | 184.43 |
Weekly price and volumes for Cords Cable
| Date |
Closing |
Open |
Range |
Volume |
Tue 02 September 2025 |
178.10 (2.5%) |
171.15 |
170.70 - 179.15 |
0.2415 times |
Fri 29 August 2025 |
173.75 (-4.22%) |
190.00 |
173.05 - 190.00 |
1.0539 times |
Fri 22 August 2025 |
181.40 (1.6%) |
179.40 |
175.75 - 189.00 |
0.8648 times |
Thu 14 August 2025 |
178.55 (1.28%) |
177.70 |
175.05 - 184.50 |
0.4259 times |
Fri 08 August 2025 |
176.30 (-6.89%) |
183.15 |
174.95 - 190.10 |
1.0921 times |
Fri 01 August 2025 |
189.35 (-7.72%) |
206.10 |
185.80 - 210.00 |
1.5021 times |
Fri 25 July 2025 |
205.20 (4.59%) |
204.90 |
202.25 - 209.90 |
2.5928 times |
Fri 18 July 2025 |
196.20 (1.06%) |
191.00 |
190.00 - 199.80 |
0.9473 times |
Fri 11 July 2025 |
194.15 (-2.29%) |
198.65 |
191.45 - 200.50 |
0.3393 times |
Fri 04 July 2025 |
198.70 (-1.66%) |
202.15 |
188.00 - 204.70 |
0.9402 times |
Fri 27 June 2025 |
202.05 (6.26%) |
192.60 |
191.10 - 207.50 |
1.4597 times |

Monthly price and charts CordsCable Strong monthly Stock price targets for CordsCable 532941 are 174.4 and 182.85 | Monthly Target 1 | 167.53 | | Monthly Target 2 | 172.82 | | Monthly Target 3 | 175.98333333333 | | Monthly Target 4 | 181.27 | | Monthly Target 5 | 184.43 |
Monthly price and volumes Cords Cable
| Date |
Closing |
Open |
Range |
Volume |
Tue 02 September 2025 |
178.10 (2.5%) |
171.15 |
170.70 - 179.15 |
0.0318 times |
Fri 29 August 2025 |
173.75 (-6.89%) |
191.75 |
173.05 - 194.50 |
0.5019 times |
Thu 31 July 2025 |
186.60 (-7.35%) |
202.10 |
185.80 - 210.00 |
0.7338 times |
Mon 30 June 2025 |
201.40 (1.67%) |
198.45 |
190.00 - 212.00 |
1.0288 times |
Fri 30 May 2025 |
198.10 (18.3%) |
164.45 |
161.65 - 222.00 |
1.6734 times |
Wed 30 April 2025 |
167.45 (6.55%) |
155.00 |
151.50 - 190.25 |
0.8712 times |
Fri 28 March 2025 |
157.15 (-7.56%) |
166.10 |
156.75 - 185.95 |
0.8927 times |
Fri 28 February 2025 |
170.00 (3.34%) |
159.45 |
155.00 - 205.15 |
1.303 times |
Fri 31 January 2025 |
164.50 (-21.22%) |
209.80 |
146.90 - 217.70 |
0.8034 times |
Tue 31 December 2024 |
208.80 (7.05%) |
195.75 |
192.60 - 246.60 |
2.1601 times |
Fri 29 November 2024 |
195.05 (-4.32%) |
205.00 |
180.70 - 225.00 |
1.0492 times |

DMA SMA EMA moving averages of Cords Cable 532941
DMA (daily moving average) of Cords Cable 532941
| DMA period | DMA value | | 5 day DMA | 176.33 | | 12 day DMA | 179.67 | | 20 day DMA | 179.04 | | 35 day DMA | 187.51 | | 50 day DMA | 190.75 | | 100 day DMA | 188.35 | | 150 day DMA | 182.87 | | 200 day DMA | 188.26 | EMA (exponential moving average) of Cords Cable 532941
| EMA period | EMA current | EMA prev | EMA prev2 | | 5 day EMA | 177.21 | 176.77 | 177.88 | | 12 day EMA | 179.1 | 179.28 | 180.14 | | 20 day EMA | 181.41 | 181.76 | 182.52 | | 35 day EMA | 185.08 | 185.49 | 186.13 | | 50 day EMA | 189.77 | 190.25 | 190.89 |
SMA (simple moving average) of Cords Cable 532941
| SMA period | SMA current | SMA prev | SMA prev2 | | 5 day SMA | 176.33 | 177.57 | 178.94 | | 12 day SMA | 179.67 | 179.9 | 179.95 | | 20 day SMA | 179.04 | 179.6 | 180.21 | | 35 day SMA | 187.51 | 187.97 | 188.53 | | 50 day SMA | 190.75 | 190.99 | 191.44 | | 100 day SMA | 188.35 | 188.18 | 188.01 | | 150 day SMA | 182.87 | 182.84 | 182.85 | | 200 day SMA | 188.26 | 188.4 | 188.55 |
|
|
