Kuantum 532937 full analysis,charts,indicators,moving averages,SMA,DMA,EMA,ADX,MACD,RSIKuantum 532937 WideScreen charts, DMA,SMA,EMA technical analysis, forecast prediction, by indicators ADX,MACD,RSI,CCI BSE stock exchange
Daily price and charts and targets Kuantum Strong Daily Stock price targets for Kuantum 532937 are 106.93 and 108.33 | Daily Target 1 | 106.65 | | Daily Target 2 | 107.2 | | Daily Target 3 | 108.05 | | Daily Target 4 | 108.6 | | Daily Target 5 | 109.45 |
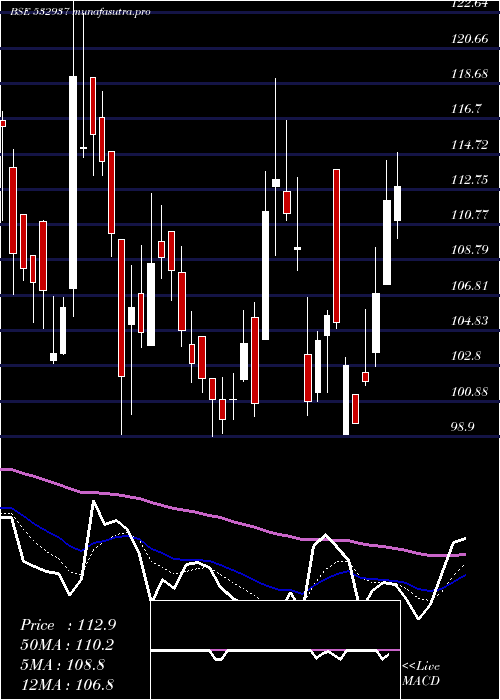
Daily price and volume Kuantum
| Date |
Closing |
Open |
Range |
Volume |
Thu 23 October 2025 |
107.75 (-0.23%) |
108.00 |
107.50 - 108.90 |
0.784 times |
Tue 21 October 2025 |
108.00 (0.19%) |
108.50 |
107.15 - 110.00 |
0.0856 times |
Mon 20 October 2025 |
107.80 (0.28%) |
108.00 |
107.50 - 108.25 |
0.6517 times |
Fri 17 October 2025 |
107.50 (-0.56%) |
108.10 |
107.00 - 109.60 |
1.8839 times |
Thu 16 October 2025 |
108.10 (0.6%) |
108.60 |
107.80 - 109.00 |
0.6474 times |
Wed 15 October 2025 |
107.45 (-1.56%) |
114.00 |
106.50 - 114.00 |
1.1257 times |
Tue 14 October 2025 |
109.15 (0.28%) |
107.90 |
107.00 - 109.15 |
0.3182 times |
Mon 13 October 2025 |
108.85 (0.05%) |
108.00 |
107.45 - 108.85 |
0.1728 times |
Fri 10 October 2025 |
108.80 (1.12%) |
108.30 |
108.00 - 109.10 |
1.2903 times |
Thu 09 October 2025 |
107.60 (-1.78%) |
112.35 |
107.25 - 112.35 |
3.0404 times |
Wed 08 October 2025 |
109.55 (1.39%) |
108.75 |
106.95 - 110.55 |
4.323 times |
Weekly price and charts Kuantum Strong weekly Stock price targets for Kuantum 532937 are 106.03 and 108.88 | Weekly Target 1 | 105.45 | | Weekly Target 2 | 106.6 | | Weekly Target 3 | 108.3 | | Weekly Target 4 | 109.45 | | Weekly Target 5 | 111.15 |
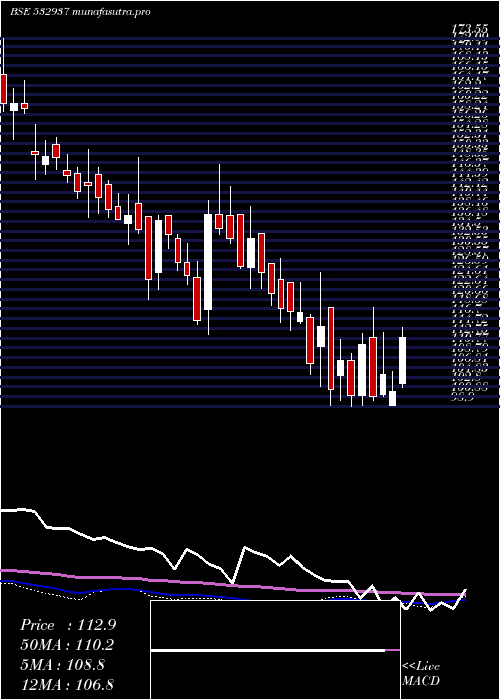
Weekly price and volumes for Kuantum
| Date |
Closing |
Open |
Range |
Volume |
Thu 23 October 2025 |
107.75 (0.23%) |
108.00 |
107.15 - 110.00 |
0.0804 times |
Fri 17 October 2025 |
107.50 (-1.19%) |
108.00 |
106.50 - 114.00 |
0.2193 times |
Fri 10 October 2025 |
108.80 (-1.63%) |
110.60 |
106.95 - 112.35 |
0.6029 times |
Fri 03 October 2025 |
110.60 (-0.49%) |
117.50 |
107.05 - 117.50 |
0.7605 times |
Fri 26 September 2025 |
111.15 (0.82%) |
110.40 |
106.10 - 120.00 |
3.283 times |
Fri 19 September 2025 |
110.25 (-1.08%) |
110.00 |
110.00 - 114.25 |
0.3825 times |
Fri 12 September 2025 |
111.45 (0.95%) |
112.70 |
109.60 - 113.50 |
0.4892 times |
Fri 05 September 2025 |
110.40 (-0.23%) |
112.40 |
106.80 - 114.00 |
1.0464 times |
Fri 29 August 2025 |
110.65 (-2.3%) |
111.50 |
110.20 - 121.95 |
1.9932 times |
Fri 22 August 2025 |
113.25 (-0.66%) |
117.35 |
113.00 - 120.50 |
1.1426 times |
Thu 14 August 2025 |
114.00 (-0.87%) |
116.95 |
113.65 - 119.15 |
0.394 times |
Monthly price and charts Kuantum Strong monthly Stock price targets for Kuantum 532937 are 103.38 and 110.88 | Monthly Target 1 | 101.92 | | Monthly Target 2 | 104.83 | | Monthly Target 3 | 109.41666666667 | | Monthly Target 4 | 112.33 | | Monthly Target 5 | 116.92 |
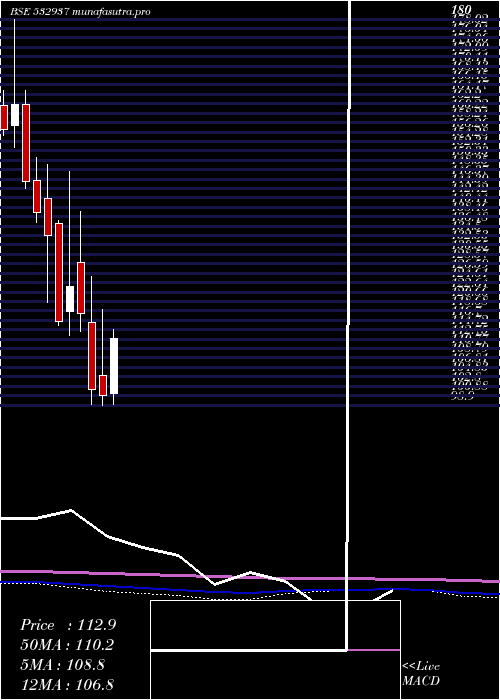
Monthly price and volumes Kuantum
| Date |
Closing |
Open |
Range |
Volume |
Thu 23 October 2025 |
107.75 (-0.23%) |
108.50 |
106.50 - 114.00 |
0.3455 times |
Tue 30 September 2025 |
108.00 (-2.39%) |
112.40 |
106.10 - 120.00 |
1.3899 times |
Fri 29 August 2025 |
110.65 (-13.82%) |
130.00 |
110.20 - 132.65 |
1.1039 times |
Thu 31 July 2025 |
128.40 (9.14%) |
119.10 |
116.50 - 134.25 |
1.2368 times |
Mon 30 June 2025 |
117.65 (2.39%) |
117.45 |
109.95 - 119.85 |
0.6551 times |
Fri 30 May 2025 |
114.90 (10.91%) |
101.05 |
99.00 - 117.50 |
0.6751 times |
Wed 30 April 2025 |
103.60 (2.73%) |
101.35 |
99.00 - 114.80 |
0.6789 times |
Fri 28 March 2025 |
100.85 (-1.37%) |
105.15 |
98.90 - 118.95 |
1.8995 times |
Fri 28 February 2025 |
102.25 (-13.46%) |
116.15 |
99.00 - 126.00 |
0.9191 times |
Fri 31 January 2025 |
118.15 (-4.56%) |
128.80 |
114.30 - 139.50 |
1.0962 times |
Tue 31 December 2024 |
123.80 (6.36%) |
118.55 |
113.55 - 148.00 |
4.835 times |
DMA SMA EMA moving averages of Kuantum 532937
DMA (daily moving average) of Kuantum 532937
| DMA period | DMA value | | 5 day DMA | 107.83 | | 12 day DMA | 108.22 | | 20 day DMA | 109 | | 35 day DMA | 110 | | 50 day DMA | 111.41 | | 100 day DMA | 116.58 | | 150 day DMA | 113.31 | | 200 day DMA | 114.55 | EMA (exponential moving average) of Kuantum 532937
| EMA period | EMA current | EMA prev | EMA prev2 | | 5 day EMA | 107.9 | 107.97 | 107.95 | | 12 day EMA | 108.34 | 108.45 | 108.53 | | 20 day EMA | 109.02 | 109.15 | 109.27 | | 35 day EMA | 110.51 | 110.67 | 110.83 | | 50 day EMA | 112.02 | 112.19 | 112.36 |
SMA (simple moving average) of Kuantum 532937
| SMA period | SMA current | SMA prev | SMA prev2 | | 5 day SMA | 107.83 | 107.77 | 108 | | 12 day SMA | 108.22 | 108.28 | 108.5 | | 20 day SMA | 109 | 109.21 | 109.37 | | 35 day SMA | 110 | 110.11 | 110.19 | | 50 day SMA | 111.41 | 111.55 | 111.93 | | 100 day SMA | 116.58 | 116.64 | 116.71 | | 150 day SMA | 113.31 | 113.31 | 113.32 | | 200 day SMA | 114.55 | 114.66 | 114.78 |
|
|
