BgrEnergy 532930 full analysis,charts,indicators,moving averages,SMA,DMA,EMA,ADX,MACD,RSIBgr Energy 532930 WideScreen charts, DMA,SMA,EMA technical analysis, forecast prediction, by indicators ADX,MACD,RSI,CCI BSE stock exchange
Daily price and charts and targets BgrEnergy Strong Daily Stock price targets for BgrEnergy 532930 are 466.85 and 466.85 | Daily Target 1 | 466.85 | | Daily Target 2 | 466.85 | | Daily Target 3 | 466.85 | | Daily Target 4 | 466.85 | | Daily Target 5 | 466.85 |
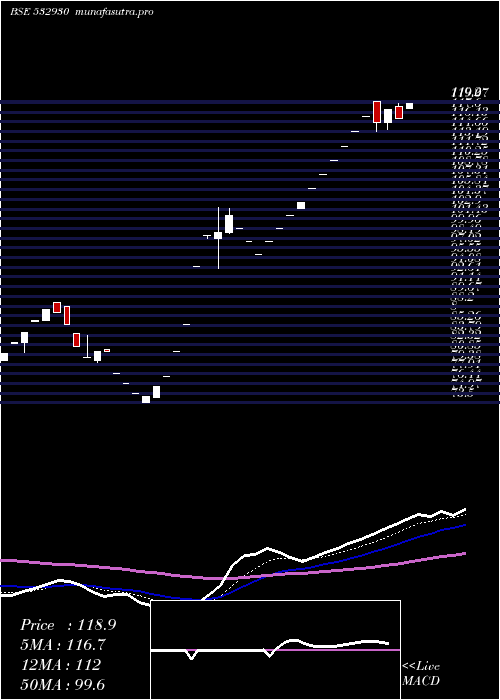
Daily price and volume Bgr Energy
| Date |
Closing |
Open |
Range |
Volume |
Thu 23 October 2025 |
466.85 (4.99%) |
466.85 |
466.85 - 466.85 |
0.1258 times |
Tue 21 October 2025 |
444.65 (4.99%) |
438.80 |
431.00 - 444.65 |
0.7136 times |
Mon 20 October 2025 |
423.50 (5%) |
416.90 |
416.90 - 423.50 |
0.6904 times |
Fri 17 October 2025 |
403.35 (5%) |
403.35 |
403.35 - 403.35 |
0.0902 times |
Thu 16 October 2025 |
384.15 (4.99%) |
368.25 |
367.00 - 384.15 |
0.5488 times |
Wed 15 October 2025 |
365.90 (-1.21%) |
370.40 |
353.00 - 383.00 |
1.6668 times |
Tue 14 October 2025 |
370.40 (4.99%) |
370.40 |
355.35 - 370.40 |
2.2682 times |
Mon 13 October 2025 |
352.80 (5%) |
335.90 |
335.90 - 352.80 |
1.7821 times |
Fri 10 October 2025 |
336.00 (5%) |
336.00 |
336.00 - 336.00 |
1.0671 times |
Thu 09 October 2025 |
320.00 (4.99%) |
320.00 |
319.60 - 320.00 |
1.0469 times |
Wed 08 October 2025 |
304.80 (4.99%) |
299.00 |
291.00 - 304.80 |
6.3218 times |
Weekly price and charts BgrEnergy Strong weekly Stock price targets for BgrEnergy 532930 are 441.88 and 491.83 | Weekly Target 1 | 400.25 | | Weekly Target 2 | 433.55 | | Weekly Target 3 | 450.2 | | Weekly Target 4 | 483.5 | | Weekly Target 5 | 500.15 |
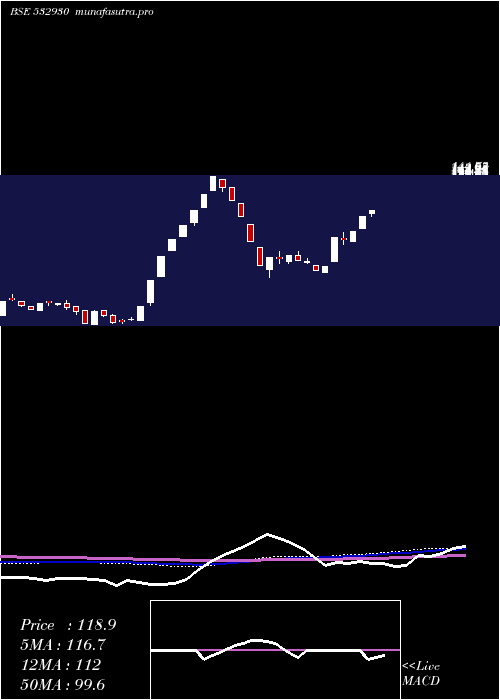
Weekly price and volumes for Bgr Energy
| Date |
Closing |
Open |
Range |
Volume |
Thu 23 October 2025 |
466.85 (15.74%) |
416.90 |
416.90 - 466.85 |
0.138 times |
Fri 17 October 2025 |
403.35 (20.04%) |
335.90 |
335.90 - 403.35 |
0.5736 times |
Fri 10 October 2025 |
336.00 (27.59%) |
276.50 |
276.50 - 336.00 |
0.9052 times |
Fri 03 October 2025 |
263.35 (17.54%) |
229.90 |
224.15 - 263.35 |
0.3006 times |
Fri 26 September 2025 |
224.05 (-16.16%) |
263.00 |
218.00 - 273.70 |
0.7035 times |
Fri 19 September 2025 |
267.25 (14.75%) |
237.80 |
230.00 - 269.50 |
1.2717 times |
Fri 12 September 2025 |
232.90 (11.09%) |
220.10 |
212.50 - 238.40 |
0.4742 times |
Fri 05 September 2025 |
209.65 (21.73%) |
171.90 |
171.00 - 209.65 |
1.2019 times |
Fri 29 August 2025 |
172.23 (-0.5%) |
180.50 |
155.83 - 181.74 |
1.1035 times |
Fri 22 August 2025 |
173.09 (53.71%) |
112.61 |
110.00 - 173.09 |
3.3278 times |
Thu 14 August 2025 |
112.61 (-10.75%) |
128.71 |
110.60 - 131.00 |
0.4037 times |
Monthly price and charts BgrEnergy Strong monthly Stock price targets for BgrEnergy 532930 are 352.9 and 580.8 | Monthly Target 1 | 162.98 | | Monthly Target 2 | 314.92 | | Monthly Target 3 | 390.88333333333 | | Monthly Target 4 | 542.82 | | Monthly Target 5 | 618.78 |
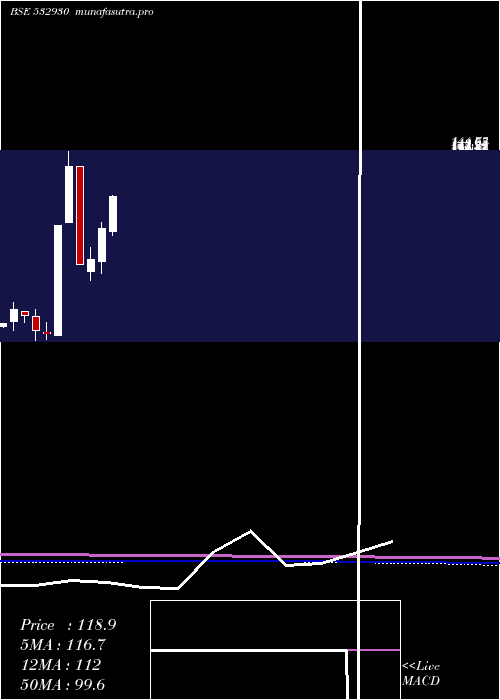
Monthly price and volumes Bgr Energy
| Date |
Closing |
Open |
Range |
Volume |
Thu 23 October 2025 |
466.85 (95.38%) |
238.95 |
238.95 - 466.85 |
0.723 times |
Tue 30 September 2025 |
238.95 (38.74%) |
171.90 |
171.00 - 273.70 |
1.4288 times |
Fri 29 August 2025 |
172.23 (74.68%) |
98.50 |
96.50 - 181.74 |
2.6448 times |
Thu 31 July 2025 |
98.60 (-2.38%) |
101.00 |
95.05 - 116.45 |
0.259 times |
Mon 30 June 2025 |
101.00 (-9.91%) |
109.90 |
96.00 - 118.75 |
0.3101 times |
Fri 30 May 2025 |
112.11 (12.15%) |
97.97 |
96.02 - 121.25 |
0.5702 times |
Wed 30 April 2025 |
99.96 (21.77%) |
80.45 |
73.50 - 103.20 |
0.5271 times |
Fri 28 March 2025 |
82.09 (4.31%) |
75.03 |
69.49 - 88.70 |
1.0382 times |
Fri 28 February 2025 |
78.70 (-42.26%) |
136.25 |
78.70 - 136.25 |
0.672 times |
Fri 31 January 2025 |
136.30 (33.97%) |
103.75 |
103.75 - 144.75 |
1.8269 times |
Tue 31 December 2024 |
101.74 (163.99%) |
37.82 |
37.82 - 101.74 |
4.9761 times |
DMA SMA EMA moving averages of Bgr Energy 532930
DMA (daily moving average) of Bgr Energy 532930
| DMA period | DMA value | | 5 day DMA | 424.5 | | 12 day DMA | 371.89 | | 20 day DMA | 320.69 | | 35 day DMA | 283.68 | | 50 day DMA | 244.32 | | 100 day DMA | 174.83 | | 150 day DMA | 148.23 | | 200 day DMA | 139.77 | EMA (exponential moving average) of Bgr Energy 532930
| EMA period | EMA current | EMA prev | EMA prev2 | | 5 day EMA | 428.09 | 408.71 | 390.75 | | 12 day EMA | 380.19 | 364.44 | 349.86 | | 20 day EMA | 343.32 | 330.32 | 318.29 | | 35 day EMA | 293.33 | 283.11 | 273.6 | | 50 day EMA | 251.9 | 243.13 | 234.91 |
SMA (simple moving average) of Bgr Energy 532930
| SMA period | SMA current | SMA prev | SMA prev2 | | 5 day SMA | 424.5 | 404.31 | 389.46 | | 12 day SMA | 371.89 | 356.03 | 340.92 | | 20 day SMA | 320.69 | 309.6 | 300.23 | | 35 day SMA | 283.68 | 275.76 | 268.22 | | 50 day SMA | 244.32 | 237.51 | 231.1 | | 100 day SMA | 174.83 | 171.3 | 168.02 | | 150 day SMA | 148.23 | 145.65 | 143.2 | | 200 day SMA | 139.77 | 137.9 | 136.13 |
|
|
