Puravankara 532891 full analysis,charts,indicators,moving averages,SMA,DMA,EMA,ADX,MACD,RSIPuravankara 532891 WideScreen charts, DMA,SMA,EMA technical analysis, forecast prediction, by indicators ADX,MACD,RSI,CCI BSE stock exchange
Daily price and charts and targets Puravankara Strong Daily Stock price targets for Puravankara 532891 are 239.73 and 246.03 | Daily Target 1 | 234.68 | | Daily Target 2 | 238.47 | | Daily Target 3 | 240.98333333333 | | Daily Target 4 | 244.77 | | Daily Target 5 | 247.28 |
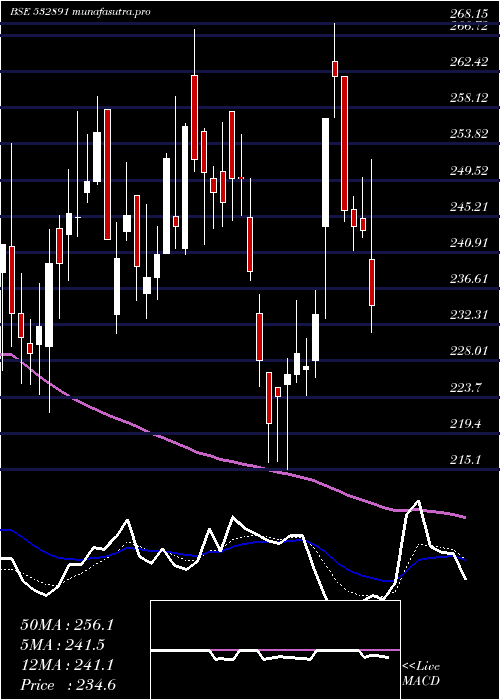
Daily price and volume Puravankara
| Date |
Closing |
Open |
Range |
Volume |
Fri 05 December 2025 |
242.25 (1.66%) |
240.55 |
237.20 - 243.50 |
0.1563 times |
Thu 04 December 2025 |
238.30 (-0.29%) |
243.00 |
237.95 - 245.50 |
1.6061 times |
Wed 03 December 2025 |
239.00 (-1.99%) |
241.00 |
238.05 - 243.30 |
1.063 times |
Tue 02 December 2025 |
243.85 (-0.97%) |
247.20 |
243.00 - 247.55 |
0.2905 times |
Mon 01 December 2025 |
246.25 (-1.44%) |
250.05 |
245.00 - 252.05 |
1.936 times |
Fri 28 November 2025 |
249.85 (0.22%) |
249.00 |
247.95 - 251.50 |
1.2619 times |
Thu 27 November 2025 |
249.30 (1.44%) |
248.50 |
244.85 - 253.00 |
0.9176 times |
Wed 26 November 2025 |
245.75 (-0.49%) |
246.35 |
244.65 - 248.55 |
0.2007 times |
Tue 25 November 2025 |
246.95 (0.59%) |
247.25 |
242.00 - 248.85 |
0.3647 times |
Mon 24 November 2025 |
245.50 (0.95%) |
240.95 |
238.00 - 247.95 |
2.2031 times |
Fri 21 November 2025 |
243.20 (-1.2%) |
243.00 |
239.10 - 245.00 |
1.382 times |
Weekly price and charts Puravankara Strong weekly Stock price targets for Puravankara 532891 are 232.3 and 247.15 | Weekly Target 1 | 228.98 | | Weekly Target 2 | 235.62 | | Weekly Target 3 | 243.83333333333 | | Weekly Target 4 | 250.47 | | Weekly Target 5 | 258.68 |
Weekly price and volumes for Puravankara
| Date |
Closing |
Open |
Range |
Volume |
Fri 05 December 2025 |
242.25 (-3.04%) |
250.05 |
237.20 - 252.05 |
0.6545 times |
Fri 28 November 2025 |
249.85 (2.73%) |
240.95 |
238.00 - 253.00 |
0.6411 times |
Fri 21 November 2025 |
243.20 (-6.64%) |
261.90 |
239.10 - 262.50 |
0.8336 times |
Fri 14 November 2025 |
260.50 (1.78%) |
250.50 |
250.50 - 265.95 |
0.8175 times |
Fri 07 November 2025 |
255.95 (-4.76%) |
267.00 |
255.30 - 270.80 |
0.5816 times |
Fri 31 October 2025 |
268.75 (-3.9%) |
286.05 |
265.70 - 286.05 |
1.1257 times |
Thu 23 October 2025 |
279.65 (4.6%) |
265.00 |
261.85 - 285.65 |
0.7523 times |
Fri 17 October 2025 |
267.35 (6.75%) |
249.30 |
246.35 - 274.50 |
2.256 times |
Fri 10 October 2025 |
250.45 (-6.43%) |
267.90 |
246.20 - 273.05 |
1.1192 times |
Fri 03 October 2025 |
267.65 (2.61%) |
260.00 |
259.30 - 279.80 |
1.2185 times |
Fri 26 September 2025 |
260.85 (-4.56%) |
272.25 |
257.90 - 276.30 |
2.2742 times |

Monthly price and charts Puravankara Strong monthly Stock price targets for Puravankara 532891 are 232.3 and 247.15 | Monthly Target 1 | 228.98 | | Monthly Target 2 | 235.62 | | Monthly Target 3 | 243.83333333333 | | Monthly Target 4 | 250.47 | | Monthly Target 5 | 258.68 |
Monthly price and volumes Puravankara
| Date |
Closing |
Open |
Range |
Volume |
Fri 05 December 2025 |
242.25 (-3.04%) |
250.05 |
237.20 - 252.05 |
0.0846 times |
Fri 28 November 2025 |
249.85 (-7.03%) |
267.00 |
238.00 - 270.80 |
0.3716 times |
Fri 31 October 2025 |
268.75 (2.09%) |
263.25 |
246.20 - 286.05 |
0.7213 times |
Tue 30 September 2025 |
263.25 (-8.53%) |
281.85 |
257.90 - 305.00 |
1.4472 times |
Fri 29 August 2025 |
287.80 (-0.67%) |
282.65 |
251.50 - 300.00 |
0.8865 times |
Thu 31 July 2025 |
289.75 (-2.39%) |
299.95 |
261.30 - 305.00 |
1.5739 times |
Mon 30 June 2025 |
296.85 (12.32%) |
254.00 |
238.70 - 338.50 |
2.1697 times |
Fri 30 May 2025 |
264.30 (12.68%) |
232.30 |
205.05 - 270.35 |
0.7702 times |
Wed 30 April 2025 |
234.55 (-5%) |
257.70 |
215.10 - 268.15 |
0.5528 times |
Fri 28 March 2025 |
246.90 (3.07%) |
243.70 |
231.25 - 267.45 |
1.4221 times |
Fri 28 February 2025 |
239.55 (-18.2%) |
300.30 |
215.35 - 300.30 |
1.8401 times |

DMA SMA EMA moving averages of Puravankara 532891
DMA (daily moving average) of Puravankara 532891
| DMA period | DMA value | | 5 day DMA | 241.93 | | 12 day DMA | 244.7 | | 20 day DMA | 249.4 | | 35 day DMA | 257.31 | | 50 day DMA | 259.17 | | 100 day DMA | 271.1 | | 150 day DMA | 270.89 | | 200 day DMA | 264.55 | EMA (exponential moving average) of Puravankara 532891
| EMA period | EMA current | EMA prev | EMA prev2 | | 5 day EMA | 242.14 | 242.08 | 243.97 | | 12 day EMA | 245.62 | 246.23 | 247.67 | | 20 day EMA | 249.22 | 249.95 | 251.18 | | 35 day EMA | 253.55 | 254.22 | 255.16 | | 50 day EMA | 258.34 | 259 | 259.84 |
SMA (simple moving average) of Puravankara 532891
| SMA period | SMA current | SMA prev | SMA prev2 | | 5 day SMA | 241.93 | 243.45 | 245.65 | | 12 day SMA | 244.7 | 245.51 | 246.85 | | 20 day SMA | 249.4 | 250.27 | 251.7 | | 35 day SMA | 257.31 | 257.68 | 258.03 | | 50 day SMA | 259.17 | 259.79 | 260.49 | | 100 day SMA | 271.1 | 271.63 | 272.12 | | 150 day SMA | 270.89 | 270.9 | 270.95 | | 200 day SMA | 264.55 | 264.75 | 265.02 |
|
|
