TimeTechno 532856 full analysis,charts,indicators,moving averages,SMA,DMA,EMA,ADX,MACD,RSITime Techno 532856 WideScreen charts, DMA,SMA,EMA technical analysis, forecast prediction, by indicators ADX,MACD,RSI,CCI BSE stock exchange
Daily price and charts and targets TimeTechno Strong Daily Stock price targets for TimeTechno 532856 are 211.78 and 219.83 | Daily Target 1 | 210.3 | | Daily Target 2 | 213.25 | | Daily Target 3 | 218.35 | | Daily Target 4 | 221.3 | | Daily Target 5 | 226.4 |
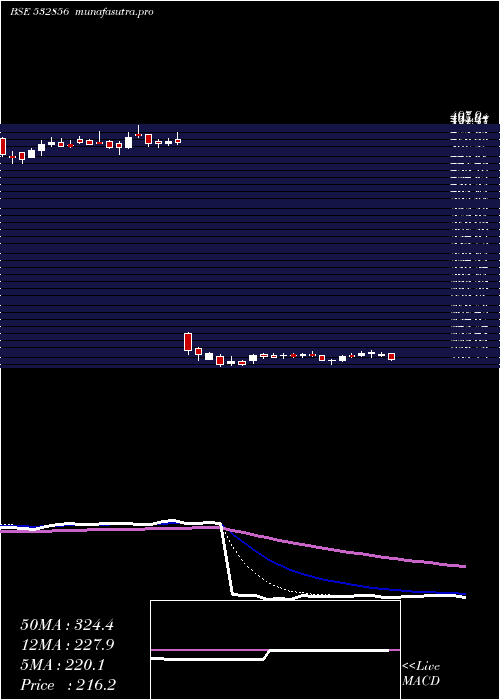
Daily price and volume Time Techno
| Date |
Closing |
Open |
Range |
Volume |
Thu 23 October 2025 |
216.20 (-2.7%) |
223.45 |
215.40 - 223.45 |
1.1134 times |
Tue 21 October 2025 |
222.20 (-0.98%) |
220.85 |
219.50 - 225.00 |
1.1094 times |
Mon 20 October 2025 |
224.40 (0.4%) |
224.00 |
219.00 - 227.10 |
1.1869 times |
Fri 17 October 2025 |
223.50 (1.54%) |
221.50 |
220.30 - 226.65 |
1.1897 times |
Thu 16 October 2025 |
220.10 (-0.25%) |
221.85 |
218.85 - 224.00 |
0.7889 times |
Wed 15 October 2025 |
220.65 (2.25%) |
215.05 |
213.85 - 221.40 |
1.2055 times |
Tue 14 October 2025 |
215.80 (0.14%) |
215.50 |
211.05 - 216.95 |
1.6963 times |
Mon 13 October 2025 |
215.50 (-2.86%) |
221.40 |
215.00 - 221.40 |
0.6398 times |
Fri 10 October 2025 |
221.85 (-0.14%) |
222.05 |
220.25 - 225.75 |
0.5826 times |
Thu 09 October 2025 |
222.15 (0.36%) |
220.75 |
219.05 - 223.50 |
0.4873 times |
Wed 08 October 2025 |
221.35 (0.11%) |
221.60 |
218.30 - 223.60 |
0.6656 times |
Weekly price and charts TimeTechno Strong weekly Stock price targets for TimeTechno 532856 are 209.95 and 221.65 | Weekly Target 1 | 207.87 | | Weekly Target 2 | 212.03 | | Weekly Target 3 | 219.56666666667 | | Weekly Target 4 | 223.73 | | Weekly Target 5 | 231.27 |
Weekly price and volumes for Time Techno
| Date |
Closing |
Open |
Range |
Volume |
Thu 23 October 2025 |
216.20 (-3.27%) |
224.00 |
215.40 - 227.10 |
0.5447 times |
Fri 17 October 2025 |
223.50 (0.74%) |
221.40 |
211.05 - 226.65 |
0.8819 times |
Fri 10 October 2025 |
221.85 (0.61%) |
221.05 |
218.25 - 225.75 |
0.5523 times |
Fri 03 October 2025 |
220.50 (4.68%) |
211.95 |
209.10 - 223.20 |
1.529 times |
Fri 26 September 2025 |
210.65 (-55.96%) |
481.30 |
208.25 - 488.90 |
2.2957 times |
Fri 19 September 2025 |
478.35 (1.45%) |
471.00 |
470.30 - 497.90 |
0.7661 times |
Fri 12 September 2025 |
471.50 (-0.35%) |
481.40 |
463.05 - 490.75 |
0.7202 times |
Fri 05 September 2025 |
473.15 (3.66%) |
459.85 |
458.70 - 483.90 |
0.6043 times |
Fri 29 August 2025 |
456.45 (-4.77%) |
476.25 |
451.50 - 490.90 |
0.4899 times |
Fri 22 August 2025 |
479.30 (7.53%) |
450.00 |
445.80 - 494.50 |
1.6159 times |
Thu 14 August 2025 |
445.75 (-2.64%) |
458.10 |
440.00 - 468.50 |
1.2027 times |

Monthly price and charts TimeTechno Strong monthly Stock price targets for TimeTechno 532856 are 213.63 and 229.68 | Monthly Target 1 | 202.07 | | Monthly Target 2 | 209.13 | | Monthly Target 3 | 218.11666666667 | | Monthly Target 4 | 225.18 | | Monthly Target 5 | 234.17 |
Monthly price and volumes Time Techno
| Date |
Closing |
Open |
Range |
Volume |
Thu 23 October 2025 |
216.20 (2.85%) |
214.80 |
211.05 - 227.10 |
0.5047 times |
Tue 30 September 2025 |
210.20 (-53.95%) |
459.85 |
208.25 - 497.90 |
0.9174 times |
Fri 29 August 2025 |
456.45 (-2.3%) |
469.25 |
438.60 - 494.50 |
0.7762 times |
Thu 31 July 2025 |
467.20 (5.32%) |
445.00 |
430.20 - 479.10 |
0.9508 times |
Mon 30 June 2025 |
443.60 (17.39%) |
378.00 |
367.00 - 463.85 |
1.5459 times |
Fri 30 May 2025 |
377.90 (12.1%) |
340.00 |
306.75 - 390.00 |
1.0079 times |
Wed 30 April 2025 |
337.10 (-19.29%) |
429.95 |
330.00 - 434.20 |
0.7434 times |
Fri 28 March 2025 |
417.65 (16.61%) |
358.35 |
340.45 - 437.15 |
1.0408 times |
Fri 28 February 2025 |
358.15 (-10.69%) |
389.75 |
325.85 - 420.85 |
1.4053 times |
Fri 31 January 2025 |
401.00 (-18.75%) |
500.90 |
343.55 - 508.00 |
1.1076 times |
Tue 31 December 2024 |
493.55 (9.76%) |
449.65 |
439.55 - 513.35 |
1.0651 times |

DMA SMA EMA moving averages of Time Techno 532856
DMA (daily moving average) of Time Techno 532856
| DMA period | DMA value | | 5 day DMA | 221.28 | | 12 day DMA | 220.4 | | 20 day DMA | 219.35 | | 35 day DMA | 322.5 | | 50 day DMA | 364.95 | | 100 day DMA | 403.72 | | 150 day DMA | 391.49 | | 200 day DMA | 396.41 | EMA (exponential moving average) of Time Techno 532856
| EMA period | EMA current | EMA prev | EMA prev2 | | 5 day EMA | 220.14 | 222.11 | 222.06 | | 12 day EMA | 227.84 | 229.95 | 231.36 | | 20 day EMA | 251.01 | 254.67 | 258.09 | | 35 day EMA | 296.56 | 301.29 | 305.95 | | 50 day EMA | 358.05 | 363.84 | 369.62 |
SMA (simple moving average) of Time Techno 532856
| SMA period | SMA current | SMA prev | SMA prev2 | | 5 day SMA | 221.28 | 222.17 | 220.89 | | 12 day SMA | 220.4 | 220.66 | 220.52 | | 20 day SMA | 219.35 | 219.9 | 232.68 | | 35 day SMA | 322.5 | 329.88 | 336.88 | | 50 day SMA | 364.95 | 369.78 | 374.35 | | 100 day SMA | 403.72 | 405.43 | 406.98 | | 150 day SMA | 391.49 | 392.62 | 393.65 | | 200 day SMA | 396.41 | 397.77 | 399.02 |
|
|
