Insectcid 532851 full analysis,charts,indicators,moving averages,SMA,DMA,EMA,ADX,MACD,RSIInsectcid 532851 WideScreen charts, DMA,SMA,EMA technical analysis, forecast prediction, by indicators ADX,MACD,RSI,CCI BSE stock exchange
Daily price and charts and targets Insectcid Strong Daily Stock price targets for Insectcid 532851 are 715.45 and 726.3 | Daily Target 1 | 706.78 | | Daily Target 2 | 713.27 | | Daily Target 3 | 717.63333333333 | | Daily Target 4 | 724.12 | | Daily Target 5 | 728.48 |
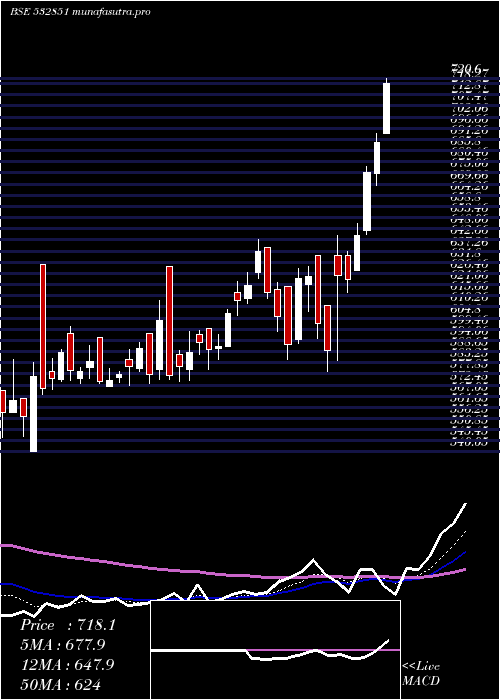
Daily price and volume Insectcid
| Date |
Closing |
Open |
Range |
Volume |
Fri 05 December 2025 |
719.75 (0.64%) |
716.85 |
711.15 - 722.00 |
0.4563 times |
Thu 04 December 2025 |
715.20 (-0.03%) |
714.85 |
710.30 - 721.20 |
0.6736 times |
Wed 03 December 2025 |
715.40 (-0.2%) |
713.20 |
709.80 - 717.90 |
0.1563 times |
Tue 02 December 2025 |
716.80 (-1.24%) |
719.95 |
711.95 - 719.95 |
0.4408 times |
Mon 01 December 2025 |
725.80 (0.22%) |
726.00 |
724.00 - 734.90 |
0.4201 times |
Fri 28 November 2025 |
724.20 (-0.1%) |
727.55 |
717.70 - 732.75 |
0.7792 times |
Thu 27 November 2025 |
724.95 (-0.97%) |
732.10 |
721.70 - 743.95 |
2.5921 times |
Wed 26 November 2025 |
732.05 (3.59%) |
715.95 |
715.80 - 746.40 |
2.9005 times |
Tue 25 November 2025 |
706.65 (-1.46%) |
717.25 |
705.15 - 725.00 |
0.624 times |
Mon 24 November 2025 |
717.10 (-0.97%) |
723.85 |
714.55 - 729.85 |
0.9572 times |
Fri 21 November 2025 |
724.15 (3.53%) |
699.50 |
695.00 - 731.00 |
2.8498 times |
Weekly price and charts Insectcid Strong weekly Stock price targets for Insectcid 532851 are 702.23 and 727.33 | Weekly Target 1 | 696.38 | | Weekly Target 2 | 708.07 | | Weekly Target 3 | 721.48333333333 | | Weekly Target 4 | 733.17 | | Weekly Target 5 | 746.58 |
Weekly price and volumes for Insectcid
| Date |
Closing |
Open |
Range |
Volume |
Fri 05 December 2025 |
719.75 (-0.61%) |
726.00 |
709.80 - 734.90 |
0.3792 times |
Fri 28 November 2025 |
724.20 (0.01%) |
723.85 |
705.15 - 746.40 |
1.3868 times |
Fri 21 November 2025 |
724.15 (8.77%) |
666.05 |
666.05 - 731.00 |
1.4367 times |
Fri 14 November 2025 |
665.75 (-3.34%) |
696.70 |
655.00 - 696.70 |
2.2117 times |
Fri 07 November 2025 |
688.75 (-3.93%) |
722.25 |
679.45 - 748.85 |
0.875 times |
Fri 31 October 2025 |
716.95 (-0.52%) |
720.00 |
708.40 - 729.40 |
0.5731 times |
Thu 23 October 2025 |
720.70 (-2.46%) |
741.65 |
712.05 - 742.05 |
0.3454 times |
Fri 17 October 2025 |
738.90 (-0.53%) |
740.90 |
713.05 - 759.10 |
0.7907 times |
Fri 10 October 2025 |
742.85 (-0.71%) |
744.35 |
719.15 - 751.45 |
1.1449 times |
Fri 03 October 2025 |
748.15 (-1.74%) |
761.40 |
732.75 - 775.10 |
0.8565 times |
Fri 26 September 2025 |
761.40 (-1.47%) |
774.95 |
751.70 - 787.00 |
1.1727 times |

Monthly price and charts Insectcid Strong monthly Stock price targets for Insectcid 532851 are 702.23 and 727.33 | Monthly Target 1 | 696.38 | | Monthly Target 2 | 708.07 | | Monthly Target 3 | 721.48333333333 | | Monthly Target 4 | 733.17 | | Monthly Target 5 | 746.58 |
Monthly price and volumes Insectcid
| Date |
Closing |
Open |
Range |
Volume |
Fri 05 December 2025 |
719.75 (-0.61%) |
726.00 |
709.80 - 734.90 |
0.0296 times |
Fri 28 November 2025 |
724.20 (1.01%) |
722.25 |
655.00 - 748.85 |
0.4607 times |
Fri 31 October 2025 |
716.95 (-4.2%) |
753.00 |
708.40 - 759.10 |
0.2431 times |
Tue 30 September 2025 |
748.35 (-9.58%) |
805.50 |
745.80 - 833.30 |
0.6709 times |
Fri 29 August 2025 |
827.60 (-22.84%) |
1080.05 |
802.00 - 1093.00 |
1.8918 times |
Thu 31 July 2025 |
1072.55 (11.06%) |
971.40 |
927.25 - 1096.30 |
1.802 times |
Mon 30 June 2025 |
965.70 (13.04%) |
845.50 |
825.45 - 988.85 |
1.5706 times |
Fri 30 May 2025 |
854.30 (23.5%) |
682.00 |
645.65 - 895.50 |
1.9028 times |
Wed 30 April 2025 |
691.75 (16.86%) |
594.75 |
579.00 - 754.85 |
0.6192 times |
Fri 28 March 2025 |
591.95 (2.98%) |
575.90 |
572.15 - 643.05 |
0.8092 times |
Fri 28 February 2025 |
574.80 (-11.06%) |
648.05 |
540.05 - 669.90 |
0.6839 times |

DMA SMA EMA moving averages of Insectcid 532851
DMA (daily moving average) of Insectcid 532851
| DMA period | DMA value | | 5 day DMA | 718.59 | | 12 day DMA | 718.46 | | 20 day DMA | 701.39 | | 35 day DMA | 709.81 | | 50 day DMA | 721.56 | | 100 day DMA | 815.42 | | 150 day DMA | 821.04 | | 200 day DMA | 768.73 | EMA (exponential moving average) of Insectcid 532851
| EMA period | EMA current | EMA prev | EMA prev2 | | 5 day EMA | 718.22 | 717.45 | 718.58 | | 12 day EMA | 714.65 | 713.72 | 713.45 | | 20 day EMA | 712.75 | 712.01 | 711.67 | | 35 day EMA | 717.72 | 717.6 | 717.74 | | 50 day EMA | 725.52 | 725.76 | 726.19 |
SMA (simple moving average) of Insectcid 532851
| SMA period | SMA current | SMA prev | SMA prev2 | | 5 day SMA | 718.59 | 719.48 | 721.43 | | 12 day SMA | 718.46 | 715.53 | 712.38 | | 20 day SMA | 701.39 | 700.31 | 700.53 | | 35 day SMA | 709.81 | 710.14 | 710.93 | | 50 day SMA | 721.56 | 722.62 | 723.76 | | 100 day SMA | 815.42 | 817.67 | 819.83 | | 150 day SMA | 821.04 | 820.87 | 820.85 | | 200 day SMA | 768.73 | 768.34 | 767.99 |
|
|
