SahyaIndu 532841 full analysis,charts,indicators,moving averages,SMA,DMA,EMA,ADX,MACD,RSISahya Indu 532841 WideScreen charts, DMA,SMA,EMA technical analysis, forecast prediction, by indicators ADX,MACD,RSI,CCI BSE stock exchange
Daily price and charts and targets SahyaIndu Strong Daily Stock price targets for SahyaIndu 532841 are 248.18 and 255.83 | Daily Target 1 | 241.8 | | Daily Target 2 | 246.9 | | Daily Target 3 | 249.45 | | Daily Target 4 | 254.55 | | Daily Target 5 | 257.1 |
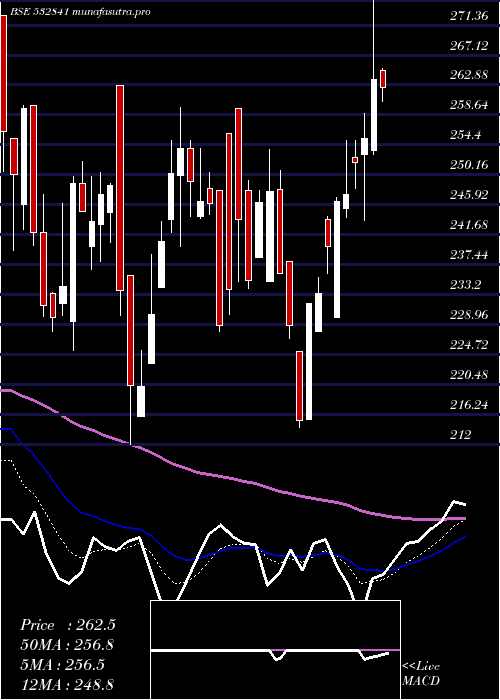
Daily price and volume Sahya Indu
| Date |
Closing |
Open |
Range |
Volume |
Fri 05 December 2025 |
252.00 (0.18%) |
252.00 |
244.35 - 252.00 |
0.4689 times |
Wed 03 December 2025 |
251.55 (-3.82%) |
258.95 |
250.00 - 258.95 |
0.1269 times |
Tue 02 December 2025 |
261.55 (3.18%) |
251.05 |
251.00 - 263.25 |
1.9267 times |
Mon 01 December 2025 |
253.50 (0.22%) |
254.00 |
251.00 - 255.00 |
3.0139 times |
Fri 28 November 2025 |
252.95 (1.02%) |
244.05 |
244.05 - 252.95 |
2.0516 times |
Thu 27 November 2025 |
250.40 (0.58%) |
252.95 |
249.80 - 252.95 |
0.0123 times |
Wed 26 November 2025 |
248.95 (0.18%) |
247.00 |
247.00 - 256.95 |
0.1495 times |
Tue 25 November 2025 |
248.50 (-0.6%) |
245.50 |
245.50 - 259.10 |
0.8661 times |
Mon 24 November 2025 |
250.00 (-0.79%) |
249.45 |
249.45 - 258.80 |
0.303 times |
Fri 21 November 2025 |
252.00 (-0.06%) |
251.95 |
250.00 - 252.05 |
1.0811 times |
Thu 20 November 2025 |
252.15 (-0.47%) |
254.80 |
252.15 - 256.95 |
0.5856 times |
Weekly price and charts SahyaIndu Strong weekly Stock price targets for SahyaIndu 532841 are 238.73 and 257.63 | Weekly Target 1 | 234.3 | | Weekly Target 2 | 243.15 | | Weekly Target 3 | 253.2 | | Weekly Target 4 | 262.05 | | Weekly Target 5 | 272.1 |
Weekly price and volumes for Sahya Indu
| Date |
Closing |
Open |
Range |
Volume |
Fri 05 December 2025 |
252.00 (-0.38%) |
254.00 |
244.35 - 263.25 |
0.5349 times |
Fri 28 November 2025 |
252.95 (0.38%) |
249.45 |
244.05 - 259.10 |
0.3268 times |
Fri 21 November 2025 |
252.00 (0.8%) |
260.00 |
250.00 - 263.20 |
0.3199 times |
Fri 14 November 2025 |
250.00 (-2%) |
251.55 |
249.00 - 257.95 |
1.1229 times |
Fri 07 November 2025 |
255.10 (0.28%) |
257.00 |
248.65 - 265.00 |
0.841 times |
Fri 31 October 2025 |
254.40 (-2.44%) |
260.00 |
251.00 - 260.00 |
0.2661 times |
Thu 23 October 2025 |
260.75 (1.97%) |
254.95 |
249.50 - 263.30 |
0.162 times |
Fri 17 October 2025 |
255.70 (-4.29%) |
264.20 |
253.05 - 277.05 |
2.0911 times |
Fri 10 October 2025 |
267.15 (-0.69%) |
269.00 |
258.00 - 277.00 |
2.3457 times |
Fri 03 October 2025 |
269.00 (3.4%) |
256.95 |
252.70 - 270.00 |
1.9896 times |
Fri 26 September 2025 |
260.15 (-4.36%) |
272.00 |
257.95 - 280.00 |
1.7097 times |

Monthly price and charts SahyaIndu Strong monthly Stock price targets for SahyaIndu 532841 are 238.73 and 257.63 | Monthly Target 1 | 234.3 | | Monthly Target 2 | 243.15 | | Monthly Target 3 | 253.2 | | Monthly Target 4 | 262.05 | | Monthly Target 5 | 272.1 |
Monthly price and volumes Sahya Indu
| Date |
Closing |
Open |
Range |
Volume |
Fri 05 December 2025 |
252.00 (-0.38%) |
254.00 |
244.35 - 263.25 |
0.1277 times |
Fri 28 November 2025 |
252.95 (-0.57%) |
257.00 |
244.05 - 265.00 |
0.6232 times |
Fri 31 October 2025 |
254.40 (-3.27%) |
263.00 |
249.50 - 277.05 |
1.2944 times |
Tue 30 September 2025 |
263.00 (11.35%) |
240.00 |
238.30 - 294.90 |
1.5402 times |
Fri 29 August 2025 |
236.20 (-21.76%) |
306.00 |
235.50 - 306.00 |
1.9605 times |
Thu 31 July 2025 |
301.90 (-2.83%) |
312.95 |
293.05 - 324.75 |
0.5925 times |
Mon 30 June 2025 |
310.70 (6.77%) |
285.00 |
285.00 - 330.00 |
0.9329 times |
Fri 30 May 2025 |
291.00 (10.12%) |
264.25 |
253.30 - 341.95 |
0.5795 times |
Wed 30 April 2025 |
264.25 (22.71%) |
215.50 |
215.50 - 290.00 |
0.3384 times |
Fri 28 March 2025 |
215.35 (-7.87%) |
235.95 |
212.00 - 259.65 |
2.0108 times |
Fri 28 February 2025 |
233.75 (-24.6%) |
312.00 |
225.30 - 317.05 |
1.7596 times |

DMA SMA EMA moving averages of Sahya Indu 532841
DMA (daily moving average) of Sahya Indu 532841
| DMA period | DMA value | | 5 day DMA | 254.31 | | 12 day DMA | 252.24 | | 20 day DMA | 252.65 | | 35 day DMA | 254.81 | | 50 day DMA | 258.1 | | 100 day DMA | 272.58 | | 150 day DMA | 279.2 | | 200 day DMA | 272.25 | EMA (exponential moving average) of Sahya Indu 532841
| EMA period | EMA current | EMA prev | EMA prev2 | | 5 day EMA | 253.29 | 253.93 | 255.12 | | 12 day EMA | 253.06 | 253.25 | 253.56 | | 20 day EMA | 253.63 | 253.8 | 254.04 | | 35 day EMA | 255.76 | 255.98 | 256.24 | | 50 day EMA | 258.4 | 258.66 | 258.95 |
SMA (simple moving average) of Sahya Indu 532841
| SMA period | SMA current | SMA prev | SMA prev2 | | 5 day SMA | 254.31 | 253.99 | 253.47 | | 12 day SMA | 252.24 | 252.67 | 252.54 | | 20 day SMA | 252.65 | 253.17 | 253.73 | | 35 day SMA | 254.81 | 255.24 | 255.69 | | 50 day SMA | 258.1 | 258.48 | 258.71 | | 100 day SMA | 272.58 | 273.06 | 273.61 | | 150 day SMA | 279.2 | 279.32 | 279.5 | | 200 day SMA | 272.25 | 272.54 | 272.82 |
|
|
