IndbulReal 532832 full analysis,charts,indicators,moving averages,SMA,DMA,EMA,ADX,MACD,RSIIndbul Real 532832 WideScreen charts, DMA,SMA,EMA technical analysis, forecast prediction, by indicators ADX,MACD,RSI,CCI BSE stock exchange
Daily price and charts and targets IndbulReal Strong Daily Stock price targets for IndbulReal 532832 are 92.83 and 94.26 | Daily Target 1 | 92.5 | | Daily Target 2 | 93.16 | | Daily Target 3 | 93.933333333333 | | Daily Target 4 | 94.59 | | Daily Target 5 | 95.36 |
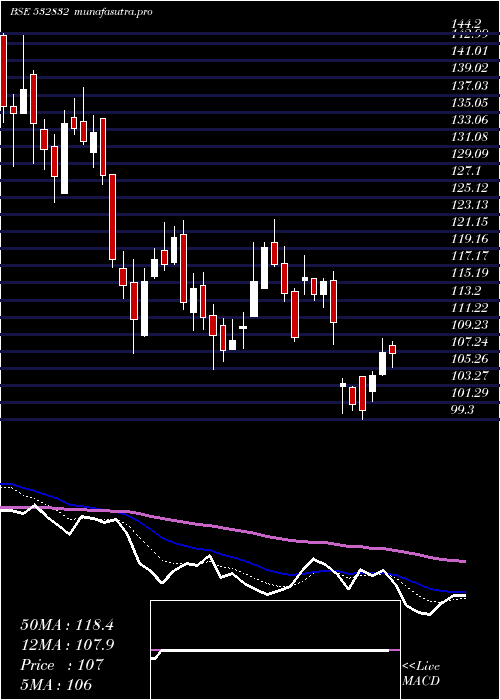
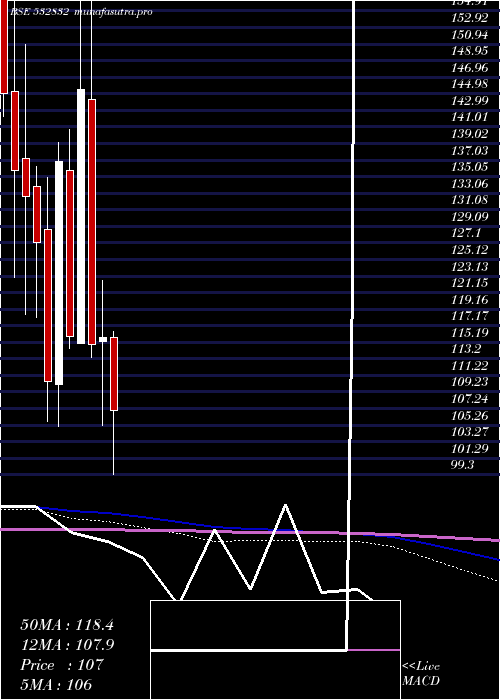
Daily price and volume Indbul Real
| Date |
Closing |
Open |
Range |
Volume |
Tue 21 October 2025 |
93.81 (-0.09%) |
94.06 |
93.28 - 94.71 |
0.1524 times |
Mon 20 October 2025 |
93.89 (1.23%) |
93.95 |
92.39 - 94.41 |
1.6275 times |
Fri 17 October 2025 |
92.75 (-0.62%) |
93.79 |
92.00 - 93.87 |
0.6644 times |
Thu 16 October 2025 |
93.33 (0.19%) |
93.97 |
92.84 - 95.42 |
0.6808 times |
Wed 15 October 2025 |
93.15 (1.42%) |
92.86 |
92.22 - 93.67 |
1.1189 times |
Tue 14 October 2025 |
91.85 (-1.11%) |
93.30 |
91.21 - 94.95 |
1.1093 times |
Mon 13 October 2025 |
92.88 (-2.43%) |
94.83 |
92.49 - 94.83 |
1.434 times |
Fri 10 October 2025 |
95.19 (1.36%) |
94.25 |
93.89 - 97.42 |
0.8854 times |
Thu 09 October 2025 |
93.91 (0.7%) |
93.91 |
93.31 - 94.30 |
1.027 times |
Wed 08 October 2025 |
93.26 (-1.56%) |
94.50 |
93.03 - 96.00 |
1.3003 times |
Tue 07 October 2025 |
94.74 (-0.61%) |
95.32 |
93.75 - 96.38 |
1.2286 times |
Weekly price and charts IndbulReal Strong weekly Stock price targets for IndbulReal 532832 are 91.94 and 94.26 | Weekly Target 1 | 91.32 | | Weekly Target 2 | 92.56 | | Weekly Target 3 | 93.636666666667 | | Weekly Target 4 | 94.88 | | Weekly Target 5 | 95.96 |
Weekly price and volumes for Indbul Real
| Date |
Closing |
Open |
Range |
Volume |
Tue 21 October 2025 |
93.81 (1.14%) |
93.95 |
92.39 - 94.71 |
0.2482 times |
Fri 17 October 2025 |
92.75 (-2.56%) |
94.83 |
91.21 - 95.42 |
0.6983 times |
Fri 10 October 2025 |
95.19 (-1.49%) |
96.19 |
93.03 - 97.42 |
0.7104 times |
Fri 03 October 2025 |
96.63 (5.53%) |
92.10 |
91.09 - 99.24 |
1.9978 times |
Fri 26 September 2025 |
91.57 (-8.58%) |
99.82 |
91.30 - 101.17 |
0.9312 times |
Fri 19 September 2025 |
100.16 (7.55%) |
93.20 |
93.16 - 105.60 |
2.1833 times |
Fri 12 September 2025 |
93.13 (-3.82%) |
96.88 |
92.75 - 97.80 |
0.7055 times |
Fri 05 September 2025 |
96.83 (3.23%) |
93.81 |
93.81 - 101.89 |
0.7866 times |
Fri 29 August 2025 |
93.80 (-5.92%) |
99.85 |
93.25 - 101.20 |
0.5823 times |
Fri 22 August 2025 |
99.70 (6.57%) |
94.10 |
93.80 - 102.50 |
1.1565 times |
Thu 14 August 2025 |
93.55 (-2.25%) |
97.45 |
91.20 - 97.45 |
0.6677 times |

Monthly price and charts IndbulReal Strong monthly Stock price targets for IndbulReal 532832 are 92.51 and 100.54 | Monthly Target 1 | 86.72 | | Monthly Target 2 | 90.27 | | Monthly Target 3 | 94.753333333333 | | Monthly Target 4 | 98.3 | | Monthly Target 5 | 102.78 |
Monthly price and volumes Indbul Real
| Date |
Closing |
Open |
Range |
Volume |
Tue 21 October 2025 |
93.81 (1.23%) |
92.26 |
91.21 - 99.24 |
0.4923 times |
Tue 30 September 2025 |
92.67 (-1.2%) |
93.81 |
91.09 - 105.60 |
0.831 times |
Fri 29 August 2025 |
93.80 (-10.96%) |
106.30 |
91.20 - 106.35 |
0.5211 times |
Thu 31 July 2025 |
105.35 (-15.18%) |
124.40 |
102.85 - 127.30 |
0.6574 times |
Mon 30 June 2025 |
124.20 (11.54%) |
112.10 |
108.25 - 127.90 |
0.8116 times |
Fri 30 May 2025 |
111.35 (13.51%) |
98.21 |
89.30 - 114.00 |
0.8667 times |
Wed 30 April 2025 |
98.10 (-15.28%) |
115.75 |
97.30 - 116.50 |
0.5929 times |
Fri 28 March 2025 |
115.80 (0.74%) |
115.25 |
105.20 - 122.60 |
0.963 times |
Fri 28 February 2025 |
114.95 (-21.02%) |
144.35 |
113.40 - 156.90 |
0.8804 times |
Fri 31 January 2025 |
145.55 (25.64%) |
115.05 |
115.05 - 163.70 |
3.3836 times |
Tue 31 December 2024 |
115.85 (-15.35%) |
135.75 |
114.40 - 140.75 |
0.6886 times |
DMA SMA EMA moving averages of Indbul Real 532832
DMA (daily moving average) of Indbul Real 532832
| DMA period | DMA value | | 5 day DMA | 93.39 | | 12 day DMA | 93.67 | | 20 day DMA | 94.06 | | 35 day DMA | 95.49 | | 50 day DMA | 95.76 | | 100 day DMA | 105.16 | | 150 day DMA | 105.44 | | 200 day DMA | 112.5 | EMA (exponential moving average) of Indbul Real 532832
| EMA period | EMA current | EMA prev | EMA prev2 | | 5 day EMA | 93.51 | 93.36 | 93.1 | | 12 day EMA | 93.79 | 93.79 | 93.77 | | 20 day EMA | 94.31 | 94.36 | 94.41 | | 35 day EMA | 95.04 | 95.11 | 95.18 | | 50 day EMA | 95.97 | 96.06 | 96.15 |
SMA (simple moving average) of Indbul Real 532832
| SMA period | SMA current | SMA prev | SMA prev2 | | 5 day SMA | 93.39 | 92.99 | 92.79 | | 12 day SMA | 93.67 | 93.91 | 94.23 | | 20 day SMA | 94.06 | 94.25 | 94.57 | | 35 day SMA | 95.49 | 95.5 | 95.5 | | 50 day SMA | 95.76 | 95.86 | 95.96 | | 100 day SMA | 105.16 | 105.27 | 105.37 | | 150 day SMA | 105.44 | 105.6 | 105.74 | | 200 day SMA | 112.5 | 112.62 | 112.75 |
|
|
