Sobha 532784 full analysis,charts,indicators,moving averages,SMA,DMA,EMA,ADX,MACD,RSISobha 532784 WideScreen charts, DMA,SMA,EMA technical analysis, forecast prediction, by indicators ADX,MACD,RSI,CCI BSE stock exchange
Daily price and charts and targets Sobha Strong Daily Stock price targets for Sobha 532784 are 1495.75 and 1543.3 | Daily Target 1 | 1483.05 | | Daily Target 2 | 1508.45 | | Daily Target 3 | 1530.6 | | Daily Target 4 | 1556 | | Daily Target 5 | 1578.15 |
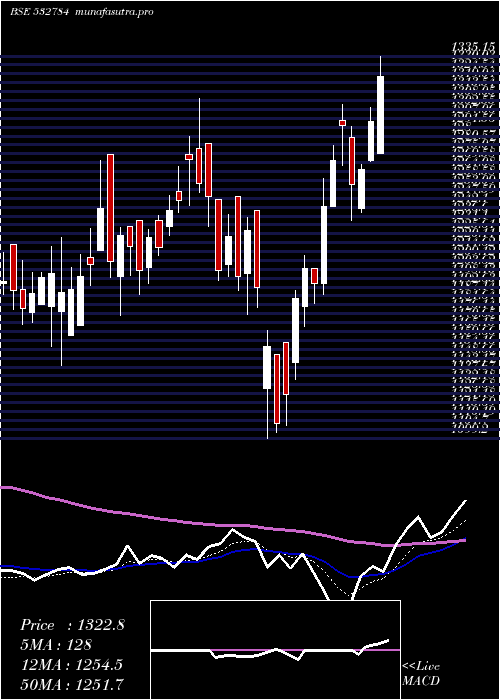
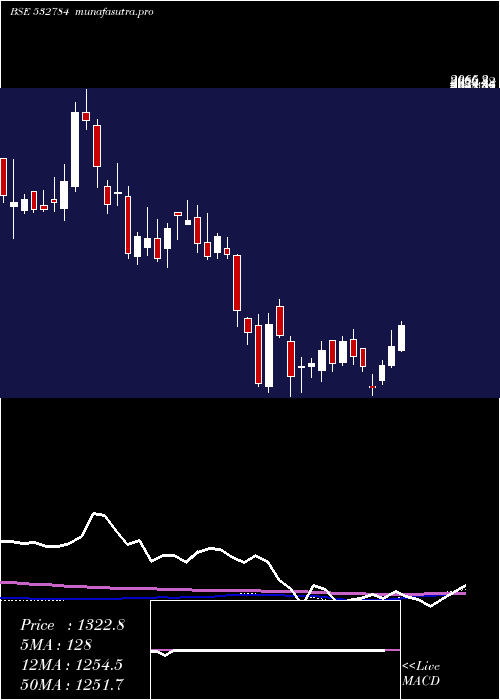
Daily price and volume Sobha
| Date |
Closing |
Open |
Range |
Volume |
Thu 23 October 2025 |
1533.85 (-0.68%) |
1548.55 |
1505.20 - 1552.75 |
0.8446 times |
Tue 21 October 2025 |
1544.40 (-0.26%) |
1578.95 |
1535.45 - 1578.95 |
0.2007 times |
Mon 20 October 2025 |
1548.35 (1.51%) |
1587.95 |
1492.90 - 1587.95 |
1.5257 times |
Fri 17 October 2025 |
1525.35 (-1.31%) |
1545.00 |
1511.10 - 1545.00 |
0.3371 times |
Thu 16 October 2025 |
1545.60 (2.49%) |
1514.85 |
1503.90 - 1553.30 |
0.81 times |
Wed 15 October 2025 |
1508.05 (4.71%) |
1443.05 |
1442.15 - 1542.00 |
3.6794 times |
Tue 14 October 2025 |
1440.25 (-0.6%) |
1448.90 |
1411.85 - 1449.65 |
0.5671 times |
Mon 13 October 2025 |
1448.90 (-0.24%) |
1441.30 |
1434.40 - 1460.80 |
0.333 times |
Fri 10 October 2025 |
1452.45 (0.63%) |
1434.65 |
1428.55 - 1475.30 |
1.2771 times |
Thu 09 October 2025 |
1443.35 (-1.06%) |
1458.00 |
1429.55 - 1480.00 |
0.4253 times |
Wed 08 October 2025 |
1458.75 (-0.74%) |
1470.80 |
1455.20 - 1476.10 |
0.1174 times |
Weekly price and charts Sobha Strong weekly Stock price targets for Sobha 532784 are 1465.85 and 1560.9 | Weekly Target 1 | 1443.18 | | Weekly Target 2 | 1488.52 | | Weekly Target 3 | 1538.2333333333 | | Weekly Target 4 | 1583.57 | | Weekly Target 5 | 1633.28 |
Weekly price and volumes for Sobha
| Date |
Closing |
Open |
Range |
Volume |
Thu 23 October 2025 |
1533.85 (0.56%) |
1587.95 |
1492.90 - 1587.95 |
0.7088 times |
Fri 17 October 2025 |
1525.35 (5.02%) |
1441.30 |
1411.85 - 1553.30 |
1.5788 times |
Fri 10 October 2025 |
1452.45 (-1.22%) |
1515.00 |
1428.55 - 1525.00 |
0.9068 times |
Fri 03 October 2025 |
1470.45 (-4.38%) |
1546.10 |
1465.00 - 1560.50 |
0.4338 times |
Fri 26 September 2025 |
1537.75 (-3.65%) |
1586.60 |
1523.10 - 1621.85 |
0.4801 times |
Fri 19 September 2025 |
1596.05 (1.69%) |
1566.00 |
1559.50 - 1649.80 |
0.8265 times |
Fri 12 September 2025 |
1569.55 (11.54%) |
1417.50 |
1414.60 - 1575.00 |
0.501 times |
Fri 05 September 2025 |
1407.15 (-1.56%) |
1427.70 |
1402.90 - 1479.95 |
2.8542 times |
Fri 29 August 2025 |
1429.50 (-3.49%) |
1475.05 |
1425.20 - 1518.40 |
0.3575 times |
Fri 22 August 2025 |
1481.15 (-3.26%) |
1540.00 |
1471.30 - 1545.00 |
1.3524 times |
Thu 14 August 2025 |
1531.10 (1.09%) |
1512.55 |
1487.00 - 1546.50 |
0.4086 times |
Monthly price and charts Sobha Strong monthly Stock price targets for Sobha 532784 are 1384.8 and 1560.9 | Monthly Target 1 | 1335.12 | | Monthly Target 2 | 1434.48 | | Monthly Target 3 | 1511.2166666667 | | Monthly Target 4 | 1610.58 | | Monthly Target 5 | 1687.32 |
Monthly price and volumes Sobha
| Date |
Closing |
Open |
Range |
Volume |
Thu 23 October 2025 |
1533.85 (-0.31%) |
1554.35 |
1411.85 - 1587.95 |
0.761 times |
Tue 30 September 2025 |
1538.60 (7.63%) |
1427.70 |
1402.90 - 1649.80 |
1.0389 times |
Fri 29 August 2025 |
1429.50 (-10.62%) |
1600.00 |
1425.20 - 1618.90 |
0.5738 times |
Thu 31 July 2025 |
1599.35 (9.12%) |
1465.65 |
1456.20 - 1732.45 |
1.2672 times |
Mon 30 June 2025 |
1465.65 (2.51%) |
1440.00 |
1424.85 - 1715.60 |
1.6265 times |
Fri 30 May 2025 |
1429.80 (8.09%) |
1321.05 |
1190.05 - 1480.70 |
0.7808 times |
Wed 30 April 2025 |
1322.75 (8.05%) |
1248.70 |
1099.20 - 1335.15 |
0.4079 times |
Fri 28 March 2025 |
1224.20 (1.91%) |
1177.70 |
1143.90 - 1309.00 |
0.8008 times |
Fri 28 February 2025 |
1201.25 (-9.26%) |
1380.00 |
1095.65 - 1403.90 |
1.1858 times |
Fri 31 January 2025 |
1323.90 (-16.04%) |
1545.40 |
1109.00 - 1599.95 |
1.5573 times |
Tue 31 December 2024 |
1576.80 (-5.54%) |
1640.05 |
1530.95 - 1716.25 |
0.5081 times |

DMA SMA EMA moving averages of Sobha 532784
DMA (daily moving average) of Sobha 532784
| DMA period | DMA value | | 5 day DMA | 1539.51 | | 12 day DMA | 1493.24 | | 20 day DMA | 1505.43 | | 35 day DMA | 1517.1 | | 50 day DMA | 1509.62 | | 100 day DMA | 1537.58 | | 150 day DMA | 1447.59 | | 200 day DMA | 1411.3 | EMA (exponential moving average) of Sobha 532784
| EMA period | EMA current | EMA prev | EMA prev2 | | 5 day EMA | 1529.96 | 1528.01 | 1519.82 | | 12 day EMA | 1514.57 | 1511.06 | 1505 | | 20 day EMA | 1512.88 | 1510.67 | 1507.12 | | 35 day EMA | 1509.8 | 1508.38 | 1506.26 | | 50 day EMA | 1516.62 | 1515.92 | 1514.76 |
SMA (simple moving average) of Sobha 532784
| SMA period | SMA current | SMA prev | SMA prev2 | | 5 day SMA | 1539.51 | 1534.35 | 1513.52 | | 12 day SMA | 1493.24 | 1488.02 | 1481.85 | | 20 day SMA | 1505.43 | 1507.6 | 1510.09 | | 35 day SMA | 1517.1 | 1515.01 | 1512.45 | | 50 day SMA | 1509.62 | 1509.23 | 1509.5 | | 100 day SMA | 1537.58 | 1536.12 | 1534.57 | | 150 day SMA | 1447.59 | 1445.41 | 1443.11 | | 200 day SMA | 1411.3 | 1411.65 | 1411.83 |
|
|
