Daawat 532783 full analysis,charts,indicators,moving averages,SMA,DMA,EMA,ADX,MACD,RSIDaawat 532783 WideScreen charts, DMA,SMA,EMA technical analysis, forecast prediction, by indicators ADX,MACD,RSI,CCI BSE stock exchange
Daily price and charts and targets Daawat Strong Daily Stock price targets for Daawat 532783 are 443.08 and 457.63 | Daily Target 1 | 431.17 | | Daily Target 2 | 440.43 | | Daily Target 3 | 445.71666666667 | | Daily Target 4 | 454.98 | | Daily Target 5 | 460.27 |
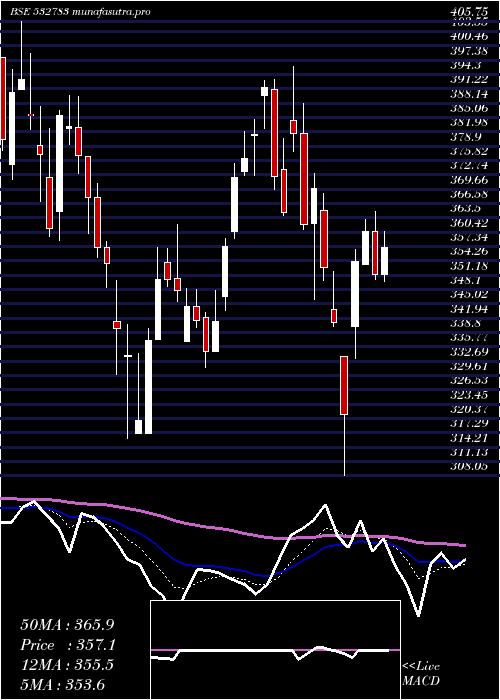
Daily price and volume Daawat
| Date |
Closing |
Open |
Range |
Volume |
Wed 03 September 2025 |
449.70 (2.97%) |
436.45 |
436.45 - 451.00 |
1.3773 times |
Tue 02 September 2025 |
436.75 (1.1%) |
433.05 |
430.70 - 441.00 |
0.742 times |
Mon 01 September 2025 |
432.00 (2.5%) |
421.05 |
421.05 - 435.00 |
1.1811 times |
Fri 29 August 2025 |
421.45 (-1.08%) |
429.95 |
420.05 - 429.95 |
0.3493 times |
Thu 28 August 2025 |
426.05 (-2.57%) |
437.30 |
422.25 - 437.35 |
0.962 times |
Tue 26 August 2025 |
437.30 (2.28%) |
424.00 |
423.95 - 442.25 |
2.2806 times |
Mon 25 August 2025 |
427.55 (-1.51%) |
432.30 |
426.10 - 439.15 |
1.46 times |
Fri 22 August 2025 |
434.10 (-3.24%) |
449.75 |
430.25 - 451.60 |
0.8289 times |
Thu 21 August 2025 |
448.65 (-1.23%) |
463.85 |
448.00 - 463.85 |
0.3842 times |
Wed 20 August 2025 |
454.25 (-0.01%) |
447.05 |
447.05 - 456.95 |
0.4347 times |
Tue 19 August 2025 |
454.30 (1.91%) |
448.00 |
446.50 - 456.95 |
0.5373 times |
Weekly price and charts Daawat Strong weekly Stock price targets for Daawat 532783 are 435.38 and 465.33 | Weekly Target 1 | 410.63 | | Weekly Target 2 | 430.17 | | Weekly Target 3 | 440.58333333333 | | Weekly Target 4 | 460.12 | | Weekly Target 5 | 470.53 |
Weekly price and volumes for Daawat
| Date |
Closing |
Open |
Range |
Volume |
Wed 03 September 2025 |
449.70 (6.7%) |
421.05 |
421.05 - 451.00 |
0.454 times |
Fri 29 August 2025 |
421.45 (-2.91%) |
432.30 |
420.05 - 442.25 |
0.695 times |
Fri 22 August 2025 |
434.10 (-2.71%) |
450.10 |
430.25 - 463.85 |
0.6627 times |
Thu 14 August 2025 |
446.20 (-1.87%) |
452.95 |
440.00 - 470.00 |
0.5029 times |
Fri 08 August 2025 |
454.70 (-4.71%) |
478.00 |
450.55 - 487.90 |
1.0736 times |
Fri 01 August 2025 |
477.15 (-2.35%) |
485.25 |
472.00 - 507.95 |
1.2775 times |
Fri 25 July 2025 |
488.65 (-3.03%) |
501.55 |
480.65 - 510.35 |
0.902 times |
Fri 18 July 2025 |
503.90 (3.83%) |
482.15 |
477.55 - 518.35 |
1.4755 times |
Fri 11 July 2025 |
485.30 (-0.38%) |
487.55 |
476.70 - 506.00 |
0.7892 times |
Fri 04 July 2025 |
487.15 (0.53%) |
480.35 |
465.95 - 509.00 |
2.1676 times |
Fri 27 June 2025 |
484.60 (13.98%) |
420.00 |
389.25 - 497.95 |
4.7633 times |

Monthly price and charts Daawat Strong monthly Stock price targets for Daawat 532783 are 435.38 and 465.33 | Monthly Target 1 | 410.63 | | Monthly Target 2 | 430.17 | | Monthly Target 3 | 440.58333333333 | | Monthly Target 4 | 460.12 | | Monthly Target 5 | 470.53 |
Monthly price and volumes Daawat
| Date |
Closing |
Open |
Range |
Volume |
Wed 03 September 2025 |
449.70 (6.7%) |
421.05 |
421.05 - 451.00 |
0.1146 times |
Fri 29 August 2025 |
421.45 (-13.42%) |
477.30 |
420.05 - 490.60 |
0.8106 times |
Thu 31 July 2025 |
486.80 (0.1%) |
486.30 |
465.95 - 518.35 |
1.4707 times |
Mon 30 June 2025 |
486.30 (10.61%) |
439.60 |
389.25 - 497.95 |
2.0556 times |
Fri 30 May 2025 |
439.65 (26.88%) |
342.60 |
329.05 - 441.65 |
1.3742 times |
Wed 30 April 2025 |
346.50 (-9.17%) |
381.55 |
308.05 - 388.00 |
0.9808 times |
Fri 28 March 2025 |
381.50 (12.32%) |
333.80 |
316.00 - 395.95 |
0.7504 times |
Fri 28 February 2025 |
339.65 (-12.98%) |
385.70 |
329.80 - 411.00 |
0.5221 times |
Fri 31 January 2025 |
390.30 (-6.91%) |
419.25 |
326.20 - 442.15 |
0.9193 times |
Tue 31 December 2024 |
419.25 (5.68%) |
399.35 |
391.50 - 451.00 |
1.0017 times |
Fri 29 November 2024 |
396.70 (2.44%) |
392.05 |
332.30 - 406.60 |
1.4309 times |

DMA SMA EMA moving averages of Daawat 532783
DMA (daily moving average) of Daawat 532783
| DMA period | DMA value | | 5 day DMA | 433.19 | | 12 day DMA | 438.99 | | 20 day DMA | 447.83 | | 35 day DMA | 467.46 | | 50 day DMA | 470.91 | | 100 day DMA | 432.49 | | 150 day DMA | 412.06 | | 200 day DMA | 409.18 | EMA (exponential moving average) of Daawat 532783
| EMA period | EMA current | EMA prev | EMA prev2 | | 5 day EMA | 438.45 | 432.82 | 430.85 | | 12 day EMA | 441.18 | 439.63 | 440.15 | | 20 day EMA | 447.81 | 447.61 | 448.75 | | 35 day EMA | 455.09 | 455.41 | 456.51 | | 50 day EMA | 464.09 | 464.68 | 465.82 |
SMA (simple moving average) of Daawat 532783
| SMA period | SMA current | SMA prev | SMA prev2 | | 5 day SMA | 433.19 | 430.71 | 428.87 | | 12 day SMA | 438.99 | 438.7 | 440.55 | | 20 day SMA | 447.83 | 449.63 | 451.65 | | 35 day SMA | 467.46 | 468.35 | 469.73 | | 50 day SMA | 470.91 | 470.02 | 469.79 | | 100 day SMA | 432.49 | 431.69 | 430.94 | | 150 day SMA | 412.06 | 411.74 | 411.49 | | 200 day SMA | 409.18 | 408.93 | 408.74 |
|
|
