GlobalVect 532773 full analysis,charts,indicators,moving averages,SMA,DMA,EMA,ADX,MACD,RSIGlobal Vect 532773 WideScreen charts, DMA,SMA,EMA technical analysis, forecast prediction, by indicators ADX,MACD,RSI,CCI BSE stock exchange
Daily price and charts and targets GlobalVect Strong Daily Stock price targets for GlobalVect 532773 are 224.95 and 232.65 | Daily Target 1 | 223.47 | | Daily Target 2 | 226.43 | | Daily Target 3 | 231.16666666667 | | Daily Target 4 | 234.13 | | Daily Target 5 | 238.87 |
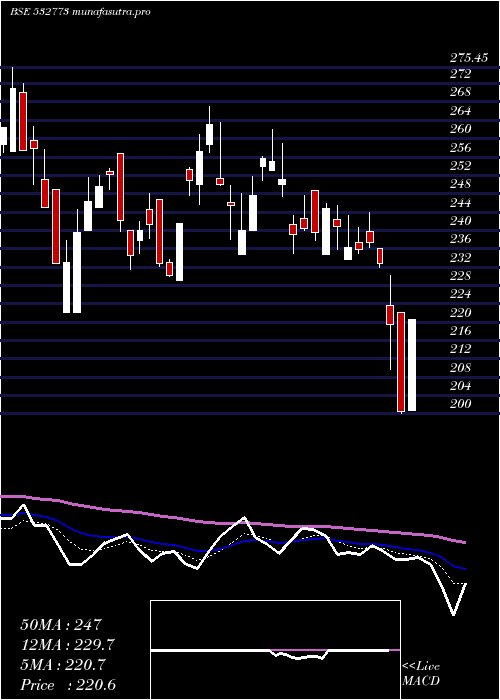
Daily price and volume Global Vect
| Date |
Closing |
Open |
Range |
Volume |
Thu 23 October 2025 |
229.40 (-1.84%) |
232.15 |
228.20 - 235.90 |
0.3865 times |
Tue 21 October 2025 |
233.70 (0.49%) |
236.45 |
231.50 - 236.45 |
0.2367 times |
Mon 20 October 2025 |
232.55 (2.09%) |
229.35 |
227.15 - 240.00 |
1.3325 times |
Fri 17 October 2025 |
227.80 (-5.24%) |
248.00 |
225.90 - 248.25 |
1.4167 times |
Thu 16 October 2025 |
240.40 (19.99%) |
209.90 |
209.90 - 240.40 |
4.7969 times |
Wed 15 October 2025 |
200.35 (2.88%) |
194.75 |
194.75 - 205.00 |
0.2948 times |
Tue 14 October 2025 |
194.75 (2.5%) |
193.00 |
192.00 - 205.00 |
0.4494 times |
Mon 13 October 2025 |
190.00 (0.34%) |
193.90 |
188.40 - 193.90 |
0.1471 times |
Fri 10 October 2025 |
189.35 (4.04%) |
182.00 |
182.00 - 195.05 |
0.1992 times |
Thu 09 October 2025 |
182.00 (-7.07%) |
197.90 |
180.00 - 197.90 |
0.7402 times |
Wed 08 October 2025 |
195.85 (-3.88%) |
200.05 |
191.50 - 203.00 |
0.415 times |
Weekly price and charts GlobalVect Strong weekly Stock price targets for GlobalVect 532773 are 228.28 and 241.13 | Weekly Target 1 | 219.33 | | Weekly Target 2 | 224.37 | | Weekly Target 3 | 232.18333333333 | | Weekly Target 4 | 237.22 | | Weekly Target 5 | 245.03 |
Weekly price and volumes for Global Vect
| Date |
Closing |
Open |
Range |
Volume |
Thu 23 October 2025 |
229.40 (0.7%) |
229.35 |
227.15 - 240.00 |
1.1475 times |
Fri 17 October 2025 |
227.80 (20.31%) |
193.90 |
188.40 - 248.25 |
4.1691 times |
Fri 10 October 2025 |
189.35 (-8.13%) |
208.25 |
180.00 - 209.75 |
0.8104 times |
Fri 03 October 2025 |
206.10 (0.15%) |
214.05 |
203.25 - 214.05 |
0.3884 times |
Fri 26 September 2025 |
205.80 (-6.96%) |
220.65 |
203.50 - 221.00 |
0.8634 times |
Fri 19 September 2025 |
221.20 (4.14%) |
238.80 |
211.95 - 238.80 |
0.6961 times |
Fri 12 September 2025 |
212.40 (1.05%) |
211.00 |
207.00 - 228.25 |
0.6489 times |
Fri 05 September 2025 |
210.20 (0.57%) |
211.85 |
208.00 - 220.00 |
0.6083 times |
Fri 29 August 2025 |
209.00 (-1.48%) |
206.00 |
204.50 - 215.65 |
0.2451 times |
Fri 22 August 2025 |
212.15 (1.87%) |
219.95 |
210.00 - 225.00 |
0.4229 times |
Thu 14 August 2025 |
208.25 (-6.61%) |
228.00 |
205.15 - 228.80 |
1.0743 times |

Monthly price and charts GlobalVect Strong monthly Stock price targets for GlobalVect 532773 are 204.7 and 272.95 | Monthly Target 1 | 150.97 | | Monthly Target 2 | 190.18 | | Monthly Target 3 | 219.21666666667 | | Monthly Target 4 | 258.43 | | Monthly Target 5 | 287.47 |
Monthly price and volumes Global Vect
| Date |
Closing |
Open |
Range |
Volume |
Thu 23 October 2025 |
229.40 (10.93%) |
206.80 |
180.00 - 248.25 |
1.4359 times |
Tue 30 September 2025 |
206.80 (-1.05%) |
211.85 |
203.50 - 238.80 |
0.735 times |
Fri 29 August 2025 |
209.00 (-6.9%) |
226.00 |
204.50 - 236.15 |
0.5374 times |
Thu 31 July 2025 |
224.50 (-7.78%) |
243.45 |
208.95 - 279.00 |
2.2094 times |
Mon 30 June 2025 |
243.45 (1%) |
264.10 |
204.00 - 284.05 |
1.4842 times |
Fri 30 May 2025 |
241.05 (9.29%) |
235.00 |
197.80 - 264.90 |
1.1473 times |
Wed 30 April 2025 |
220.55 (-8.07%) |
239.90 |
200.00 - 262.00 |
0.7648 times |
Fri 28 March 2025 |
239.90 (3.07%) |
222.10 |
222.10 - 267.00 |
0.5289 times |
Fri 28 February 2025 |
232.75 (-22.36%) |
289.90 |
232.75 - 311.90 |
0.5813 times |
Fri 31 January 2025 |
299.80 (9.06%) |
276.25 |
259.35 - 303.25 |
0.5758 times |
Tue 31 December 2024 |
274.90 (8.23%) |
259.90 |
259.00 - 344.70 |
0.5582 times |

DMA SMA EMA moving averages of Global Vect 532773
DMA (daily moving average) of Global Vect 532773
| DMA period | DMA value | | 5 day DMA | 232.77 | | 12 day DMA | 209.99 | | 20 day DMA | 208.94 | | 35 day DMA | 211.12 | | 50 day DMA | 212.1 | | 100 day DMA | 225.6 | | 150 day DMA | 227.87 | | 200 day DMA | 238.7 | EMA (exponential moving average) of Global Vect 532773
| EMA period | EMA current | EMA prev | EMA prev2 | | 5 day EMA | 226.93 | 225.7 | 221.7 | | 12 day EMA | 217.69 | 215.56 | 212.26 | | 20 day EMA | 214.17 | 212.57 | 210.35 | | 35 day EMA | 213.11 | 212.15 | 210.88 | | 50 day EMA | 215.51 | 214.94 | 214.17 |
SMA (simple moving average) of Global Vect 532773
| SMA period | SMA current | SMA prev | SMA prev2 | | 5 day SMA | 232.77 | 226.96 | 219.17 | | 12 day SMA | 209.99 | 208.17 | 205.87 | | 20 day SMA | 208.94 | 208.23 | 207.24 | | 35 day SMA | 211.12 | 210.65 | 209.94 | | 50 day SMA | 212.1 | 211.97 | 211.96 | | 100 day SMA | 225.6 | 225.71 | 225.77 | | 150 day SMA | 227.87 | 228.01 | 228.09 | | 200 day SMA | 238.7 | 238.99 | 239.28 |
|
|
