RichaInd 532766 full analysis,charts,indicators,moving averages,SMA,DMA,EMA,ADX,MACD,RSIRicha Ind 532766 WideScreen charts, DMA,SMA,EMA technical analysis, forecast prediction, by indicators ADX,MACD,RSI,CCI BSE stock exchange
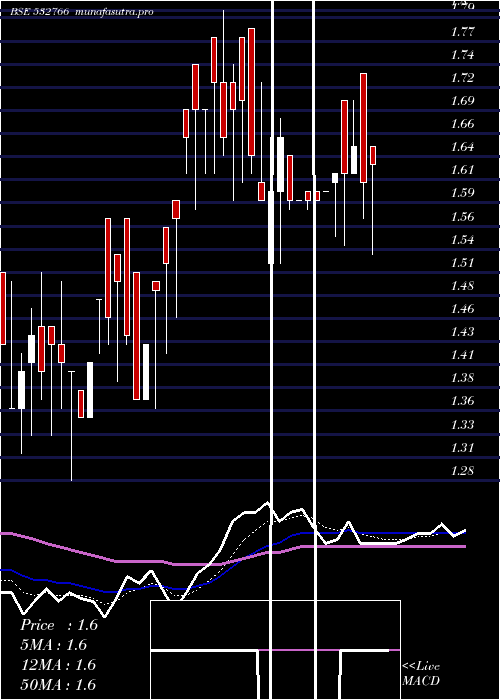
Daily price and charts and targets RichaInd Strong Daily Stock price targets for RichaInd 532766 are 1.58 and 1.72 | Daily Target 1 | 1.47 | | Daily Target 2 | 1.55 | | Daily Target 3 | 1.6066666666667 | | Daily Target 4 | 1.69 | | Daily Target 5 | 1.75 |
Daily price and volume Richa Ind
| Date |
Closing |
Open |
Range |
Volume |
Mon 14 July 2025 |
1.64 (3.14%) |
1.59 |
1.52 - 1.66 |
2.122 times |
Fri 11 July 2025 |
1.59 (0.63%) |
1.65 |
1.59 - 1.65 |
0.074 times |
Thu 10 July 2025 |
1.58 (2.6%) |
1.61 |
1.47 - 1.61 |
0.4309 times |
Wed 09 July 2025 |
1.54 (-1.91%) |
1.64 |
1.50 - 1.64 |
0.3882 times |
Tue 08 July 2025 |
1.57 (-4.85%) |
1.71 |
1.57 - 1.71 |
0.6714 times |
Mon 07 July 2025 |
1.65 (-4.07%) |
1.72 |
1.65 - 1.80 |
1.7068 times |
Fri 04 July 2025 |
1.72 (4.88%) |
1.72 |
1.62 - 1.72 |
2.6241 times |
Thu 03 July 2025 |
1.64 (-3.53%) |
1.70 |
1.62 - 1.78 |
0.3107 times |
Wed 02 July 2025 |
1.70 (0%) |
1.67 |
1.62 - 1.78 |
0.2373 times |
Tue 01 July 2025 |
1.70 (0%) |
1.74 |
1.62 - 1.78 |
1.4347 times |
Mon 30 June 2025 |
1.70 (2.41%) |
1.74 |
1.60 - 1.74 |
1.7921 times |
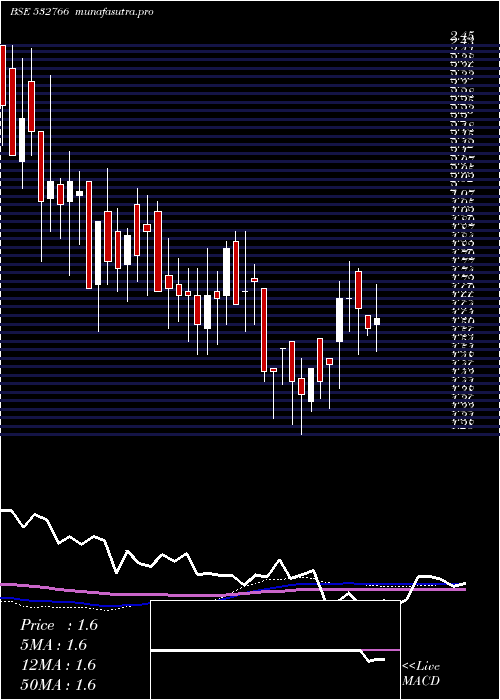
Weekly price and charts RichaInd Strong weekly Stock price targets for RichaInd 532766 are 1.58 and 1.72 | Weekly Target 1 | 1.47 | | Weekly Target 2 | 1.55 | | Weekly Target 3 | 1.6066666666667 | | Weekly Target 4 | 1.69 | | Weekly Target 5 | 1.75 |
Weekly price and volumes for Richa Ind
| Date |
Closing |
Open |
Range |
Volume |
Mon 14 July 2025 |
1.64 (3.14%) |
1.59 |
1.52 - 1.66 |
0.8814 times |
Fri 11 July 2025 |
1.59 (-7.56%) |
1.72 |
1.47 - 1.80 |
1.3587 times |
Fri 04 July 2025 |
1.72 (3.61%) |
1.74 |
1.60 - 1.78 |
2.6577 times |
Fri 27 June 2025 |
1.66 (2.47%) |
1.62 |
1.50 - 1.77 |
0.9633 times |
Thu 19 June 2025 |
1.62 (-4.14%) |
1.67 |
1.48 - 1.69 |
0.4917 times |
Fri 13 June 2025 |
1.69 (7.64%) |
1.64 |
1.50 - 1.73 |
1.2595 times |
Fri 06 June 2025 |
1.57 (-2.48%) |
1.61 |
1.47 - 1.73 |
0.9923 times |
Fri 30 May 2025 |
1.61 (-1.23%) |
1.63 |
1.55 - 1.77 |
0.4512 times |
Fri 23 May 2025 |
1.63 (1.87%) |
1.61 |
1.53 - 1.73 |
0.7814 times |
Fri 16 May 2025 |
1.60 (-3.61%) |
1.64 |
1.58 - 1.64 |
0.1628 times |
Fri 09 May 2025 |
1.66 (-1.78%) |
1.77 |
1.52 - 1.78 |
0.946 times |
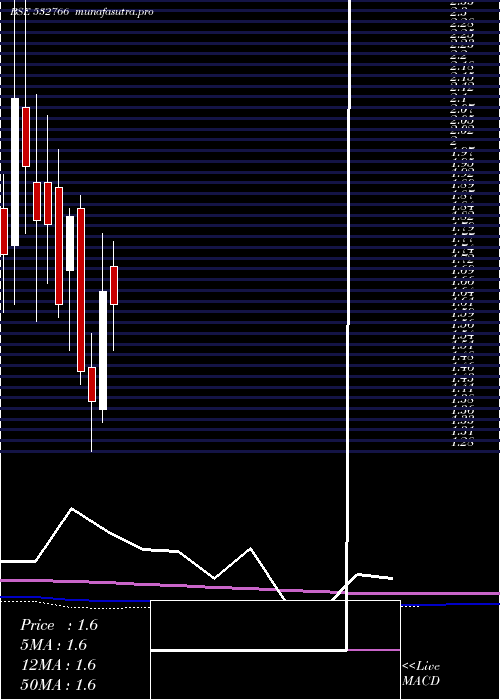
Monthly price and charts RichaInd Strong monthly Stock price targets for RichaInd 532766 are 1.39 and 1.72 | Monthly Target 1 | 1.31 | | Monthly Target 2 | 1.47 | | Monthly Target 3 | 1.6366666666667 | | Monthly Target 4 | 1.8 | | Monthly Target 5 | 1.97 |
Monthly price and volumes Richa Ind
| Date |
Closing |
Open |
Range |
Volume |
Mon 14 July 2025 |
1.64 (-3.53%) |
1.74 |
1.47 - 1.80 |
0.7964 times |
Mon 30 June 2025 |
1.70 (5.59%) |
1.61 |
1.47 - 1.77 |
0.8535 times |
Fri 30 May 2025 |
1.61 (-3.01%) |
1.72 |
1.52 - 1.78 |
0.4576 times |
Wed 30 April 2025 |
1.66 (18.57%) |
1.38 |
1.35 - 1.80 |
0.8879 times |
Fri 28 March 2025 |
1.40 (-4.76%) |
1.48 |
1.28 - 1.56 |
0.6701 times |
Fri 28 February 2025 |
1.47 (-20.11%) |
1.86 |
1.44 - 1.89 |
0.6522 times |
Fri 31 January 2025 |
1.84 (12.88%) |
1.71 |
1.52 - 1.86 |
1.1255 times |
Tue 31 December 2024 |
1.63 (-10.44%) |
1.91 |
1.60 - 2.00 |
2.5682 times |
Fri 29 November 2024 |
1.82 (-0.55%) |
1.92 |
1.68 - 2.08 |
1.2982 times |
Thu 31 October 2024 |
1.83 (-6.63%) |
1.92 |
1.59 - 2.13 |
0.6903 times |
Mon 30 September 2024 |
1.96 (-7.55%) |
2.10 |
1.80 - 2.44 |
1.0978 times |
DMA SMA EMA moving averages of Richa Ind 532766
DMA (daily moving average) of Richa Ind 532766
| DMA period | DMA value | | 5 day DMA | 1.58 | | 12 day DMA | 1.64 | | 20 day DMA | 1.63 | | 35 day DMA | 1.63 | | 50 day DMA | 1.63 | | 100 day DMA | 1.59 | | 150 day DMA | 1.64 | | 200 day DMA | 1.71 | EMA (exponential moving average) of Richa Ind 532766
| EMA period | EMA current | EMA prev | EMA prev2 | | 5 day EMA | 1.61 | 1.6 | 1.6 | | 12 day EMA | 1.62 | 1.62 | 1.62 | | 20 day EMA | 1.63 | 1.63 | 1.63 | | 35 day EMA | 1.63 | 1.63 | 1.63 | | 50 day EMA | 1.64 | 1.64 | 1.64 |
SMA (simple moving average) of Richa Ind 532766
| SMA period | SMA current | SMA prev | SMA prev2 | | 5 day SMA | 1.58 | 1.59 | 1.61 | | 12 day SMA | 1.64 | 1.64 | 1.65 | | 20 day SMA | 1.63 | 1.64 | 1.64 | | 35 day SMA | 1.63 | 1.63 | 1.63 | | 50 day SMA | 1.63 | 1.63 | 1.63 | | 100 day SMA | 1.59 | 1.59 | 1.59 | | 150 day SMA | 1.64 | 1.64 | 1.64 | | 200 day SMA | 1.71 | 1.71 | 1.71 |
|
|
