Atlanta 532759 full analysis,charts,indicators,moving averages,SMA,DMA,EMA,ADX,MACD,RSIAtlanta 532759 WideScreen charts, DMA,SMA,EMA technical analysis, forecast prediction, by indicators ADX,MACD,RSI,CCI BSE stock exchange
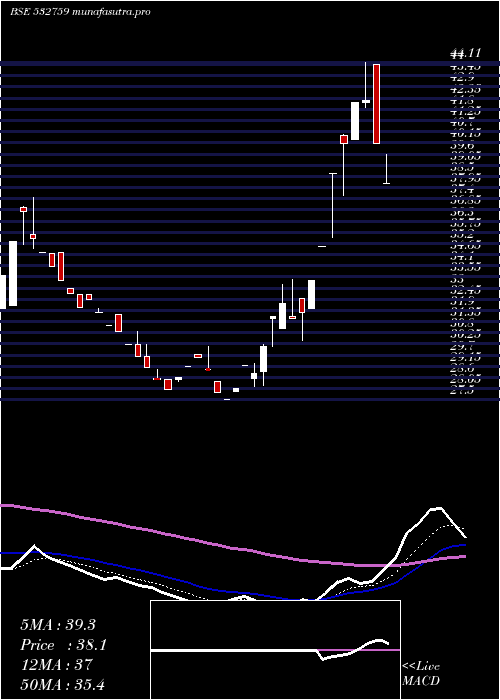
Daily price and charts and targets Atlanta Strong Daily Stock price targets for Atlanta 532759 are 50.16 and 52.93 | Daily Target 1 | 47.99 | | Daily Target 2 | 49.56 | | Daily Target 3 | 50.763333333333 | | Daily Target 4 | 52.33 | | Daily Target 5 | 53.53 |
Daily price and volume Atlanta
| Date |
Closing |
Open |
Range |
Volume |
Tue 21 October 2025 |
51.12 (1.29%) |
50.39 |
49.20 - 51.97 |
0.0539 times |
Mon 20 October 2025 |
50.47 (1.04%) |
51.80 |
48.55 - 52.44 |
0.3619 times |
Fri 17 October 2025 |
49.95 (4.98%) |
46.03 |
46.03 - 49.95 |
0.7593 times |
Thu 16 October 2025 |
47.58 (-4.95%) |
48.60 |
47.56 - 50.90 |
1.1425 times |
Wed 15 October 2025 |
50.06 (-4.99%) |
50.06 |
50.06 - 53.00 |
1.3229 times |
Tue 14 October 2025 |
52.69 (-4.99%) |
52.69 |
52.69 - 56.50 |
2.2784 times |
Mon 13 October 2025 |
55.46 (-4.99%) |
55.46 |
55.46 - 55.46 |
0.6244 times |
Fri 10 October 2025 |
58.37 (-4.25%) |
57.92 |
57.92 - 64.00 |
2.2772 times |
Thu 09 October 2025 |
60.96 (-4.99%) |
60.96 |
60.96 - 60.96 |
0.3854 times |
Wed 08 October 2025 |
64.16 (-4.99%) |
64.25 |
64.16 - 65.00 |
0.7941 times |
Tue 07 October 2025 |
67.53 (0.61%) |
67.88 |
65.05 - 73.17 |
8.3721 times |
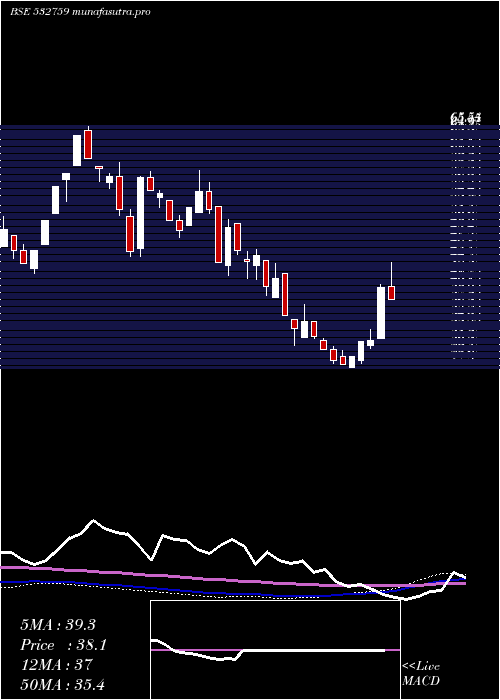
Weekly price and charts Atlanta Strong weekly Stock price targets for Atlanta 532759 are 47.89 and 51.78 | Weekly Target 1 | 46.81 | | Weekly Target 2 | 48.97 | | Weekly Target 3 | 50.703333333333 | | Weekly Target 4 | 52.86 | | Weekly Target 5 | 54.59 |
Weekly price and volumes for Atlanta
| Date |
Closing |
Open |
Range |
Volume |
Tue 21 October 2025 |
51.12 (2.34%) |
51.80 |
48.55 - 52.44 |
0.0577 times |
Fri 17 October 2025 |
49.95 (-14.43%) |
55.46 |
46.03 - 56.50 |
0.8498 times |
Fri 10 October 2025 |
58.37 (4.31%) |
61.98 |
57.92 - 73.17 |
4.5115 times |
Fri 03 October 2025 |
55.96 (42.61%) |
38.95 |
37.72 - 55.96 |
2.1441 times |
Fri 26 September 2025 |
39.24 (-5.58%) |
46.80 |
38.67 - 46.80 |
0.1563 times |
Fri 19 September 2025 |
41.56 (0.05%) |
39.11 |
38.11 - 45.90 |
0.4085 times |
Fri 12 September 2025 |
41.54 (24.86%) |
33.40 |
31.60 - 46.50 |
1.3749 times |
Fri 05 September 2025 |
33.27 (10.28%) |
30.11 |
29.42 - 37.00 |
0.3524 times |
Fri 29 August 2025 |
30.17 (-8.1%) |
33.11 |
30.00 - 33.93 |
0.0332 times |
Fri 22 August 2025 |
32.83 (5.43%) |
31.52 |
31.15 - 35.88 |
0.1116 times |
Thu 14 August 2025 |
31.14 (-10%) |
33.10 |
30.90 - 39.00 |
0.8168 times |
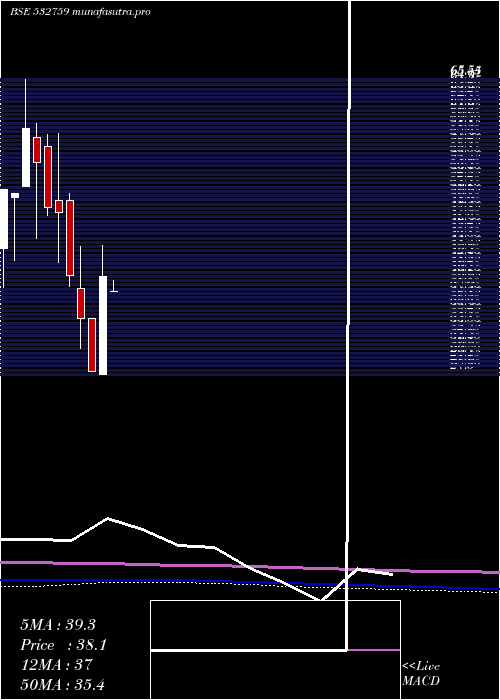
Monthly price and charts Atlanta Strong monthly Stock price targets for Atlanta 532759 are 48.01 and 76.28 | Monthly Target 1 | 28.13 | | Monthly Target 2 | 39.62 | | Monthly Target 3 | 56.396666666667 | | Monthly Target 4 | 67.89 | | Monthly Target 5 | 84.67 |
Monthly price and volumes Atlanta
| Date |
Closing |
Open |
Range |
Volume |
Tue 21 October 2025 |
51.12 (31.52%) |
45.03 |
44.90 - 73.17 |
5.5004 times |
Tue 30 September 2025 |
38.87 (28.84%) |
30.11 |
29.42 - 46.80 |
1.6876 times |
Fri 29 August 2025 |
30.17 (-9.4%) |
33.97 |
30.00 - 39.00 |
0.9712 times |
Thu 31 July 2025 |
33.30 (-4.75%) |
35.17 |
31.35 - 39.00 |
0.3797 times |
Mon 30 June 2025 |
34.96 (-6.62%) |
35.81 |
33.45 - 38.95 |
0.1648 times |
Fri 30 May 2025 |
37.44 (-6.73%) |
38.14 |
33.04 - 40.67 |
0.3327 times |
Wed 30 April 2025 |
40.14 (44.08%) |
27.50 |
27.50 - 44.11 |
0.3198 times |
Fri 28 March 2025 |
27.86 (-19.78%) |
34.70 |
27.86 - 34.73 |
0.1961 times |
Fri 28 February 2025 |
34.73 (-13.69%) |
38.55 |
30.89 - 44.00 |
0.2408 times |
Fri 31 January 2025 |
40.24 (-16.95%) |
50.00 |
38.81 - 50.90 |
0.2069 times |
Tue 31 December 2024 |
48.45 (-1.34%) |
50.00 |
42.01 - 58.65 |
0.3191 times |
DMA SMA EMA moving averages of Atlanta 532759
DMA (daily moving average) of Atlanta 532759
| DMA period | DMA value | | 5 day DMA | 49.84 | | 12 day DMA | 56.29 | | 20 day DMA | 50.93 | | 35 day DMA | 45.57 | | 50 day DMA | 41.94 | | 100 day DMA | 38.78 | | 150 day DMA | 37.09 | | 200 day DMA | 38.19 | EMA (exponential moving average) of Atlanta 532759
| EMA period | EMA current | EMA prev | EMA prev2 | | 5 day EMA | 51.08 | 51.06 | 51.36 | | 12 day EMA | 51.81 | 51.94 | 52.21 | | 20 day EMA | 50.35 | 50.27 | 50.25 | | 35 day EMA | 46.74 | 46.48 | 46.25 | | 50 day EMA | 42.09 | 41.72 | 41.36 |
SMA (simple moving average) of Atlanta 532759
| SMA period | SMA current | SMA prev | SMA prev2 | | 5 day SMA | 49.84 | 50.15 | 51.15 | | 12 day SMA | 56.29 | 56.69 | 56.37 | | 20 day SMA | 50.93 | 50.45 | 50 | | 35 day SMA | 45.57 | 45.14 | 44.56 | | 50 day SMA | 41.94 | 41.61 | 41.27 | | 100 day SMA | 38.78 | 38.63 | 38.49 | | 150 day SMA | 37.09 | 36.97 | 36.85 | | 200 day SMA | 38.19 | 38.18 | 38.19 |
|
|
