VoltampTran 532757 full analysis,charts,indicators,moving averages,SMA,DMA,EMA,ADX,MACD,RSIVoltamp Tran 532757 WideScreen charts, DMA,SMA,EMA technical analysis, forecast prediction, by indicators ADX,MACD,RSI,CCI BSE stock exchange
Daily price and charts and targets VoltampTran Strong Daily Stock price targets for VoltampTran 532757 are 7123.63 and 7245.13 | Daily Target 1 | 7098.07 | | Daily Target 2 | 7149.18 | | Daily Target 3 | 7219.5666666667 | | Daily Target 4 | 7270.68 | | Daily Target 5 | 7341.07 |
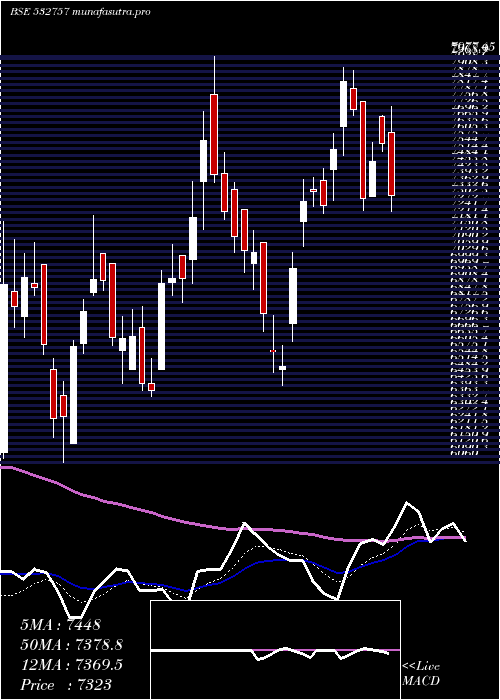
Daily price and volume Voltamp Tran
| Date |
Closing |
Open |
Range |
Volume |
Tue 21 October 2025 |
7200.30 (0.65%) |
7289.95 |
7168.45 - 7289.95 |
0.6435 times |
Mon 20 October 2025 |
7154.15 (0.82%) |
7126.60 |
7103.50 - 7163.90 |
0.5866 times |
Fri 17 October 2025 |
7095.70 (-1.47%) |
7170.75 |
7076.90 - 7200.00 |
1.6074 times |
Thu 16 October 2025 |
7201.40 (1.45%) |
7106.95 |
7106.95 - 7234.50 |
1.2065 times |
Wed 15 October 2025 |
7098.55 (1%) |
7021.35 |
7021.35 - 7138.00 |
0.7523 times |
Tue 14 October 2025 |
7028.35 (-1.08%) |
7077.00 |
7001.50 - 7161.15 |
1.1584 times |
Mon 13 October 2025 |
7104.75 (-1.19%) |
7170.00 |
7086.45 - 7170.00 |
0.554 times |
Fri 10 October 2025 |
7190.45 (1.51%) |
7136.60 |
7083.15 - 7212.55 |
1.2279 times |
Thu 09 October 2025 |
7083.15 (-0.75%) |
7162.30 |
7066.75 - 7162.30 |
1.2397 times |
Wed 08 October 2025 |
7136.60 (-1.22%) |
7249.95 |
7118.00 - 7249.95 |
1.0237 times |
Tue 07 October 2025 |
7225.10 (0.61%) |
7150.05 |
7146.65 - 7239.10 |
1.9299 times |
Weekly price and charts VoltampTran Strong weekly Stock price targets for VoltampTran 532757 are 7151.9 and 7338.35 | Weekly Target 1 | 7011.47 | | Weekly Target 2 | 7105.88 | | Weekly Target 3 | 7197.9166666667 | | Weekly Target 4 | 7292.33 | | Weekly Target 5 | 7384.37 |
Weekly price and volumes for Voltamp Tran
| Date |
Closing |
Open |
Range |
Volume |
Tue 21 October 2025 |
7200.30 (1.47%) |
7126.60 |
7103.50 - 7289.95 |
0.0648 times |
Fri 17 October 2025 |
7095.70 (-1.32%) |
7170.00 |
7001.50 - 7234.50 |
0.278 times |
Fri 10 October 2025 |
7190.45 (0.31%) |
7200.00 |
7066.75 - 7249.95 |
0.3301 times |
Fri 03 October 2025 |
7168.55 (2.48%) |
6910.05 |
6910.05 - 7284.65 |
0.1943 times |
Fri 26 September 2025 |
6994.80 (-5.61%) |
7479.95 |
6965.20 - 7479.95 |
0.4237 times |
Fri 19 September 2025 |
7410.85 (1.56%) |
7299.45 |
7174.75 - 7480.00 |
3.2256 times |
Fri 12 September 2025 |
7297.00 (-7.25%) |
7899.85 |
7106.00 - 7904.10 |
4.8666 times |
Fri 05 September 2025 |
7867.00 (0.72%) |
7851.05 |
7839.95 - 8153.90 |
0.2091 times |
Fri 29 August 2025 |
7810.65 (-4.96%) |
8388.95 |
7801.00 - 8388.95 |
0.1232 times |
Fri 22 August 2025 |
8217.85 (4.08%) |
7999.15 |
7931.45 - 8299.95 |
0.2846 times |
Thu 14 August 2025 |
7895.60 (-0.89%) |
8100.00 |
7871.00 - 8127.65 |
0.1725 times |

Monthly price and charts VoltampTran Strong monthly Stock price targets for VoltampTran 532757 are 6956.68 and 7245.13 | Monthly Target 1 | 6875.47 | | Monthly Target 2 | 7037.88 | | Monthly Target 3 | 7163.9166666667 | | Monthly Target 4 | 7326.33 | | Monthly Target 5 | 7452.37 |
Monthly price and volumes Voltamp Tran
| Date |
Closing |
Open |
Range |
Volume |
Tue 21 October 2025 |
7200.30 (-0.37%) |
7235.00 |
7001.50 - 7289.95 |
0.2129 times |
Tue 30 September 2025 |
7227.15 (-7.47%) |
7851.05 |
6910.05 - 8153.90 |
2.4643 times |
Fri 29 August 2025 |
7810.65 (-11.47%) |
8815.00 |
7801.00 - 8823.85 |
0.3386 times |
Thu 31 July 2025 |
8823.10 (-7.35%) |
9619.35 |
8517.10 - 10078.75 |
0.8195 times |
Mon 30 June 2025 |
9523.35 (14.93%) |
8281.00 |
8200.05 - 9619.20 |
1.1865 times |
Fri 30 May 2025 |
8286.25 (13.15%) |
7379.45 |
7180.00 - 8943.45 |
1.2168 times |
Wed 30 April 2025 |
7323.00 (2.69%) |
7254.95 |
6426.05 - 7928.55 |
0.7607 times |
Fri 28 March 2025 |
7131.20 (13.75%) |
6380.00 |
6060.00 - 7977.45 |
1.1283 times |
Fri 28 February 2025 |
6269.05 (-24.99%) |
7902.00 |
6057.50 - 8074.75 |
1.0076 times |
Fri 31 January 2025 |
8358.15 (-17.54%) |
10200.00 |
6900.00 - 10698.95 |
0.8647 times |
Tue 31 December 2024 |
10135.60 (-0.1%) |
10145.30 |
9810.00 - 11539.15 |
0.3449 times |

DMA SMA EMA moving averages of Voltamp Tran 532757
DMA (daily moving average) of Voltamp Tran 532757
| DMA period | DMA value | | 5 day DMA | 7150.02 | | 12 day DMA | 7141.67 | | 20 day DMA | 7143.7 | | 35 day DMA | 7318.21 | | 50 day DMA | 7531.45 | | 100 day DMA | 8293.39 | | 150 day DMA | 8033.16 | | 200 day DMA | 8028.48 | EMA (exponential moving average) of Voltamp Tran 532757
| EMA period | EMA current | EMA prev | EMA prev2 | | 5 day EMA | 7155.2 | 7132.65 | 7121.9 | | 12 day EMA | 7155.88 | 7147.81 | 7146.66 | | 20 day EMA | 7205.98 | 7206.58 | 7212.1 | | 35 day EMA | 7375.24 | 7385.54 | 7399.16 | | 50 day EMA | 7561.9 | 7576.65 | 7593.89 |
SMA (simple moving average) of Voltamp Tran 532757
| SMA period | SMA current | SMA prev | SMA prev2 | | 5 day SMA | 7150.02 | 7115.63 | 7105.75 | | 12 day SMA | 7141.67 | 7139.02 | 7141.56 | | 20 day SMA | 7143.7 | 7152.75 | 7165.59 | | 35 day SMA | 7318.21 | 7340.63 | 7359.39 | | 50 day SMA | 7531.45 | 7548.17 | 7569.14 | | 100 day SMA | 8293.39 | 8304.21 | 8315.41 | | 150 day SMA | 8033.16 | 8030.31 | 8026.69 | | 200 day SMA | 8028.48 | 8042.68 | 8056.24 |
|
|
