TechMah 532755 full analysis,charts,indicators,moving averages,SMA,DMA,EMA,ADX,MACD,RSITech Mah 532755 WideScreen charts, DMA,SMA,EMA technical analysis, forecast prediction, by indicators ADX,MACD,RSI,CCI BSE stock exchange
Daily price and charts and targets TechMah Strong Daily Stock price targets for TechMah 532755 are 1563.35 and 1589 | Daily Target 1 | 1544.08 | | Daily Target 2 | 1556.97 | | Daily Target 3 | 1569.7333333333 | | Daily Target 4 | 1582.62 | | Daily Target 5 | 1595.38 |
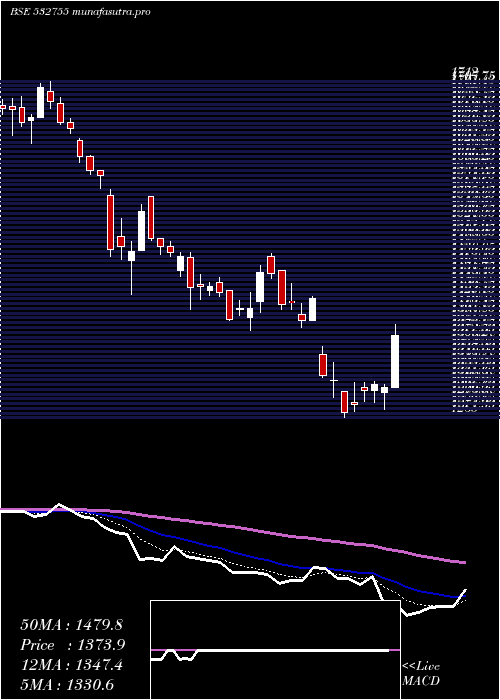
Daily price and volume Tech Mah
| Date |
Closing |
Open |
Range |
Volume |
Fri 05 December 2025 |
1569.85 (0.53%) |
1568.05 |
1556.85 - 1582.50 |
0.4472 times |
Thu 04 December 2025 |
1561.55 (1.28%) |
1541.85 |
1541.50 - 1578.10 |
1.5535 times |
Wed 03 December 2025 |
1541.80 (0.41%) |
1542.95 |
1530.80 - 1550.70 |
0.3107 times |
Tue 02 December 2025 |
1535.55 (0.46%) |
1512.45 |
1512.45 - 1538.35 |
0.4061 times |
Mon 01 December 2025 |
1528.55 (0.77%) |
1519.50 |
1510.00 - 1531.20 |
0.2832 times |
Fri 28 November 2025 |
1516.85 (0.46%) |
1510.35 |
1507.95 - 1525.75 |
0.9953 times |
Thu 27 November 2025 |
1509.95 (-0.67%) |
1520.30 |
1505.50 - 1532.55 |
1.166 times |
Wed 26 November 2025 |
1520.10 (1.67%) |
1502.45 |
1495.00 - 1521.50 |
1.1153 times |
Tue 25 November 2025 |
1495.15 (0.03%) |
1500.20 |
1483.40 - 1500.35 |
0.7536 times |
Mon 24 November 2025 |
1494.70 (2.32%) |
1472.55 |
1463.30 - 1514.00 |
2.9692 times |
Fri 21 November 2025 |
1460.85 (0.28%) |
1450.05 |
1439.65 - 1469.00 |
0.9946 times |
Weekly price and charts TechMah Strong weekly Stock price targets for TechMah 532755 are 1539.93 and 1612.43 | Weekly Target 1 | 1481.62 | | Weekly Target 2 | 1525.73 | | Weekly Target 3 | 1554.1166666667 | | Weekly Target 4 | 1598.23 | | Weekly Target 5 | 1626.62 |
Weekly price and volumes for Tech Mah
| Date |
Closing |
Open |
Range |
Volume |
Fri 05 December 2025 |
1569.85 (3.49%) |
1519.50 |
1510.00 - 1582.50 |
0.3458 times |
Fri 28 November 2025 |
1516.85 (3.83%) |
1472.55 |
1463.30 - 1532.55 |
0.8066 times |
Fri 21 November 2025 |
1460.85 (1.57%) |
1440.80 |
1420.00 - 1469.00 |
4.723 times |
Fri 14 November 2025 |
1438.25 (3.68%) |
1385.30 |
1384.45 - 1464.65 |
1.2069 times |
Fri 07 November 2025 |
1387.15 (-2.64%) |
1420.00 |
1384.80 - 1423.85 |
0.5283 times |
Fri 31 October 2025 |
1424.80 (-2.6%) |
1455.65 |
1420.90 - 1475.15 |
0.3621 times |
Thu 23 October 2025 |
1462.85 (1.06%) |
1446.35 |
1438.35 - 1487.00 |
0.168 times |
Fri 17 October 2025 |
1447.55 (-0.67%) |
1447.10 |
1439.35 - 1479.40 |
0.7965 times |
Fri 10 October 2025 |
1457.25 (4.03%) |
1402.65 |
1398.00 - 1475.00 |
0.6239 times |
Fri 03 October 2025 |
1400.75 (-0.48%) |
1410.55 |
1392.00 - 1426.65 |
0.4388 times |
Fri 26 September 2025 |
1407.50 (-9.43%) |
1491.20 |
1403.90 - 1510.55 |
0.6736 times |

Monthly price and charts TechMah Strong monthly Stock price targets for TechMah 532755 are 1539.93 and 1612.43 | Monthly Target 1 | 1481.62 | | Monthly Target 2 | 1525.73 | | Monthly Target 3 | 1554.1166666667 | | Monthly Target 4 | 1598.23 | | Monthly Target 5 | 1626.62 |
Monthly price and volumes Tech Mah
| Date |
Closing |
Open |
Range |
Volume |
Fri 05 December 2025 |
1569.85 (3.49%) |
1519.50 |
1510.00 - 1582.50 |
0.1479 times |
Fri 28 November 2025 |
1516.85 (6.46%) |
1420.00 |
1384.45 - 1532.55 |
3.1075 times |
Fri 31 October 2025 |
1424.80 (1.79%) |
1393.20 |
1393.20 - 1487.00 |
0.9258 times |
Tue 30 September 2025 |
1399.70 (-5.51%) |
1481.45 |
1392.00 - 1567.45 |
0.933 times |
Fri 29 August 2025 |
1481.30 (1.18%) |
1459.95 |
1420.90 - 1539.20 |
0.69 times |
Thu 31 July 2025 |
1464.05 (-13.23%) |
1695.55 |
1436.60 - 1699.00 |
0.9932 times |
Mon 30 June 2025 |
1687.30 (7.2%) |
1565.30 |
1534.00 - 1732.45 |
0.8192 times |
Fri 30 May 2025 |
1574.00 (4.75%) |
1502.65 |
1461.20 - 1635.95 |
0.7312 times |
Wed 30 April 2025 |
1502.60 (5.97%) |
1402.10 |
1265.00 - 1510.60 |
1.1161 times |
Fri 28 March 2025 |
1418.00 (-4.76%) |
1506.85 |
1381.00 - 1558.95 |
0.536 times |
Fri 28 February 2025 |
1488.90 (-11.08%) |
1639.80 |
1480.00 - 1712.00 |
0.4098 times |

DMA SMA EMA moving averages of Tech Mah 532755
DMA (daily moving average) of Tech Mah 532755
| DMA period | DMA value | | 5 day DMA | 1547.46 | | 12 day DMA | 1515.97 | | 20 day DMA | 1480.22 | | 35 day DMA | 1464.66 | | 50 day DMA | 1457.64 | | 100 day DMA | 1484.6 | | 150 day DMA | 1524.53 | | 200 day DMA | 1518.14 | EMA (exponential moving average) of Tech Mah 532755
| EMA period | EMA current | EMA prev | EMA prev2 | | 5 day EMA | 1548.96 | 1538.51 | 1526.99 | | 12 day EMA | 1519.87 | 1510.79 | 1501.57 | | 20 day EMA | 1499.55 | 1492.15 | 1484.85 | | 35 day EMA | 1484.07 | 1479.02 | 1474.16 | | 50 day EMA | 1473.48 | 1469.55 | 1465.8 |
SMA (simple moving average) of Tech Mah 532755
| SMA period | SMA current | SMA prev | SMA prev2 | | 5 day SMA | 1547.46 | 1536.86 | 1526.54 | | 12 day SMA | 1515.97 | 1503.57 | 1494.57 | | 20 day SMA | 1480.22 | 1472.43 | 1464.79 | | 35 day SMA | 1464.66 | 1461.27 | 1458.29 | | 50 day SMA | 1457.64 | 1457.32 | 1457.09 | | 100 day SMA | 1484.6 | 1485.06 | 1485.79 | | 150 day SMA | 1524.53 | 1523.81 | 1523.15 | | 200 day SMA | 1518.14 | 1518.56 | 1519.13 |
|
|
