GodawariPow 532734 full analysis,charts,indicators,moving averages,SMA,DMA,EMA,ADX,MACD,RSIGodawari Pow 532734 WideScreen charts, DMA,SMA,EMA technical analysis, forecast prediction, by indicators ADX,MACD,RSI,CCI BSE stock exchange
Daily price and charts and targets GodawariPow Strong Daily Stock price targets for GodawariPow 532734 are 254.28 and 256.63 | Daily Target 1 | 253.73 | | Daily Target 2 | 254.82 | | Daily Target 3 | 256.08333333333 | | Daily Target 4 | 257.17 | | Daily Target 5 | 258.43 |
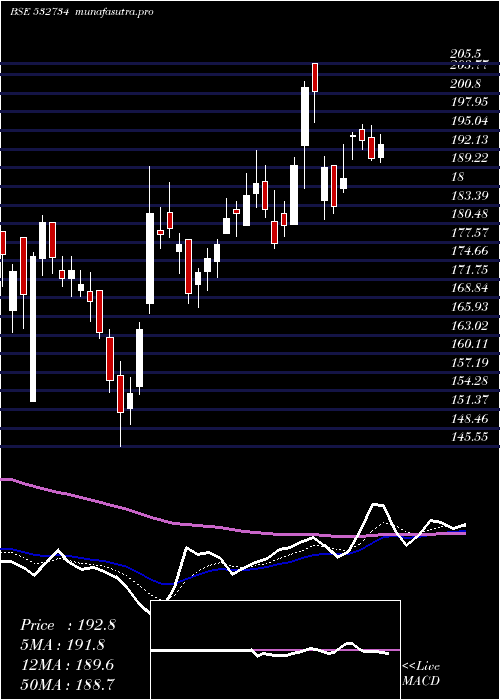
Daily price and volume Godawari Pow
| Date |
Closing |
Open |
Range |
Volume |
Tue 21 October 2025 |
255.90 (1.45%) |
256.00 |
255.00 - 257.35 |
0.3802 times |
Mon 20 October 2025 |
252.25 (1.1%) |
249.95 |
247.65 - 254.30 |
0.9236 times |
Fri 17 October 2025 |
249.50 (2.72%) |
240.50 |
240.50 - 258.40 |
3.5829 times |
Thu 16 October 2025 |
242.90 (-2.23%) |
250.80 |
241.90 - 251.00 |
0.6128 times |
Wed 15 October 2025 |
248.45 (1.68%) |
241.90 |
241.90 - 251.00 |
1.6775 times |
Tue 14 October 2025 |
244.35 (1.52%) |
240.45 |
235.95 - 245.00 |
0.7534 times |
Mon 13 October 2025 |
240.70 (-1.07%) |
242.15 |
239.70 - 244.55 |
0.6009 times |
Fri 10 October 2025 |
243.30 (0.06%) |
243.25 |
240.60 - 244.95 |
0.1946 times |
Thu 09 October 2025 |
243.15 (0.81%) |
241.15 |
238.95 - 246.00 |
0.4981 times |
Wed 08 October 2025 |
241.20 (-1.01%) |
245.35 |
240.30 - 245.35 |
0.776 times |
Tue 07 October 2025 |
243.65 (-0.89%) |
245.95 |
240.65 - 247.15 |
1.5554 times |
Weekly price and charts GodawariPow Strong weekly Stock price targets for GodawariPow 532734 are 251.78 and 261.48 | Weekly Target 1 | 243.93 | | Weekly Target 2 | 249.92 | | Weekly Target 3 | 253.63333333333 | | Weekly Target 4 | 259.62 | | Weekly Target 5 | 263.33 |
Weekly price and volumes for Godawari Pow
| Date |
Closing |
Open |
Range |
Volume |
Tue 21 October 2025 |
255.90 (2.57%) |
249.95 |
247.65 - 257.35 |
0.1065 times |
Fri 17 October 2025 |
249.50 (2.55%) |
242.15 |
235.95 - 258.40 |
0.5905 times |
Fri 10 October 2025 |
243.30 (-1.76%) |
246.65 |
238.95 - 249.00 |
0.3415 times |
Fri 03 October 2025 |
247.65 (-3.43%) |
245.00 |
241.05 - 258.40 |
0.2828 times |
Fri 26 September 2025 |
256.45 (-2.01%) |
264.50 |
252.20 - 278.00 |
1.333 times |
Fri 19 September 2025 |
261.70 (7.25%) |
245.00 |
245.00 - 276.00 |
2.9276 times |
Fri 12 September 2025 |
244.00 (0.62%) |
243.15 |
235.40 - 248.00 |
0.259 times |
Fri 05 September 2025 |
242.50 (4.35%) |
235.05 |
235.05 - 255.70 |
1.0244 times |
Fri 29 August 2025 |
232.40 (-2.48%) |
239.80 |
231.15 - 249.45 |
0.803 times |
Fri 22 August 2025 |
238.30 (17.42%) |
201.60 |
197.05 - 241.60 |
2.3318 times |
Thu 14 August 2025 |
202.95 (8.15%) |
186.80 |
185.90 - 206.10 |
0.2521 times |

Monthly price and charts GodawariPow Strong monthly Stock price targets for GodawariPow 532734 are 245.93 and 268.38 | Monthly Target 1 | 227.63 | | Monthly Target 2 | 241.77 | | Monthly Target 3 | 250.08333333333 | | Monthly Target 4 | 264.22 | | Monthly Target 5 | 272.53 |
Monthly price and volumes Godawari Pow
| Date |
Closing |
Open |
Range |
Volume |
Tue 21 October 2025 |
255.90 (4.53%) |
244.05 |
235.95 - 258.40 |
0.556 times |
Tue 30 September 2025 |
244.80 (5.34%) |
235.05 |
235.05 - 278.00 |
2.6875 times |
Fri 29 August 2025 |
232.40 (19.7%) |
194.15 |
185.20 - 249.45 |
1.9809 times |
Thu 31 July 2025 |
194.15 (2.62%) |
188.15 |
179.35 - 198.15 |
0.7339 times |
Mon 30 June 2025 |
189.20 (-0.79%) |
190.20 |
175.20 - 198.00 |
0.5134 times |
Fri 30 May 2025 |
190.70 (4.12%) |
179.60 |
170.35 - 210.25 |
0.6005 times |
Wed 30 April 2025 |
183.15 (1.67%) |
180.35 |
180.35 - 205.50 |
0.6174 times |
Fri 28 March 2025 |
180.15 (15.48%) |
156.75 |
145.55 - 191.85 |
0.9115 times |
Fri 28 February 2025 |
156.00 (-13.45%) |
175.05 |
152.60 - 189.95 |
0.7376 times |
Fri 31 January 2025 |
180.25 (-11.12%) |
200.25 |
161.55 - 214.40 |
0.6613 times |
Tue 31 December 2024 |
202.80 (7.67%) |
189.35 |
185.65 - 253.60 |
1.3028 times |

DMA SMA EMA moving averages of Godawari Pow 532734
DMA (daily moving average) of Godawari Pow 532734
| DMA period | DMA value | | 5 day DMA | 249.8 | | 12 day DMA | 245.93 | | 20 day DMA | 249.54 | | 35 day DMA | 250.15 | | 50 day DMA | 240.58 | | 100 day DMA | 214.4 | | 150 day DMA | 205.9 | | 200 day DMA | 200.33 | EMA (exponential moving average) of Godawari Pow 532734
| EMA period | EMA current | EMA prev | EMA prev2 | | 5 day EMA | 250.72 | 248.13 | 246.07 | | 12 day EMA | 248.63 | 247.31 | 246.41 | | 20 day EMA | 247.87 | 247.02 | 246.47 | | 35 day EMA | 242.26 | 241.46 | 240.82 | | 50 day EMA | 237.67 | 236.93 | 236.31 |
SMA (simple moving average) of Godawari Pow 532734
| SMA period | SMA current | SMA prev | SMA prev2 | | 5 day SMA | 249.8 | 247.49 | 245.18 | | 12 day SMA | 245.93 | 245.25 | 244.76 | | 20 day SMA | 249.54 | 249.92 | 250.39 | | 35 day SMA | 250.15 | 249.67 | 249.1 | | 50 day SMA | 240.58 | 239.28 | 238.05 | | 100 day SMA | 214.4 | 213.8 | 213.24 | | 150 day SMA | 205.9 | 205.29 | 204.63 | | 200 day SMA | 200.33 | 200.12 | 199.95 |
|
|
