UttamSugar 532729 full analysis,charts,indicators,moving averages,SMA,DMA,EMA,ADX,MACD,RSIUttam Sugar 532729 WideScreen charts, DMA,SMA,EMA technical analysis, forecast prediction, by indicators ADX,MACD,RSI,CCI BSE stock exchange
Daily price and charts and targets UttamSugar Strong Daily Stock price targets for UttamSugar 532729 are 266.43 and 272.78 | Daily Target 1 | 265.25 | | Daily Target 2 | 267.6 | | Daily Target 3 | 271.6 | | Daily Target 4 | 273.95 | | Daily Target 5 | 277.95 |
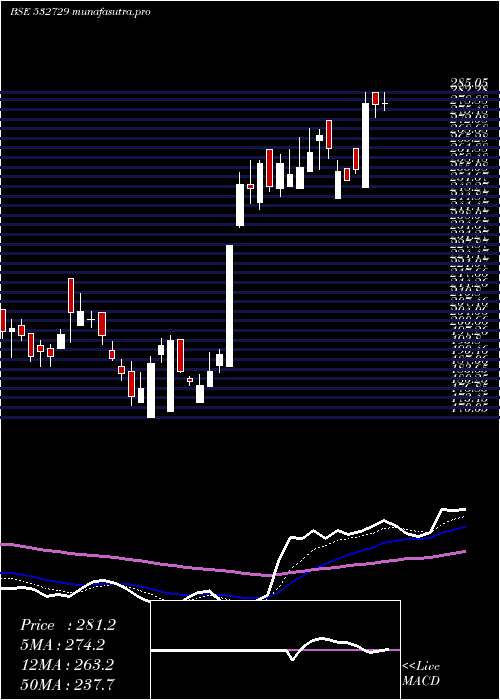
Daily price and volume Uttam Sugar
| Date |
Closing |
Open |
Range |
Volume |
Wed 03 September 2025 |
269.95 (0.65%) |
273.50 |
269.25 - 275.60 |
0.8646 times |
Tue 02 September 2025 |
268.20 (1.84%) |
275.00 |
264.00 - 299.00 |
7.9523 times |
Mon 01 September 2025 |
263.35 (-2.41%) |
269.85 |
261.25 - 269.85 |
0.1983 times |
Fri 29 August 2025 |
269.85 (-1.89%) |
279.95 |
266.00 - 283.80 |
0.1269 times |
Thu 28 August 2025 |
275.05 (4.54%) |
261.70 |
257.60 - 280.25 |
0.0873 times |
Tue 26 August 2025 |
263.10 (-1.11%) |
263.55 |
261.70 - 266.90 |
0.0092 times |
Mon 25 August 2025 |
266.05 (0.95%) |
264.75 |
261.70 - 267.05 |
0.0609 times |
Fri 22 August 2025 |
263.55 (-1.29%) |
267.45 |
261.85 - 268.50 |
0.4196 times |
Thu 21 August 2025 |
267.00 (1.58%) |
265.25 |
261.95 - 268.05 |
0.0476 times |
Wed 20 August 2025 |
262.85 (4.89%) |
250.40 |
249.45 - 269.05 |
0.2334 times |
Tue 19 August 2025 |
250.60 (2.47%) |
243.10 |
243.10 - 253.50 |
0.0657 times |
Weekly price and charts UttamSugar Strong weekly Stock price targets for UttamSugar 532729 are 265.6 and 303.35 | Weekly Target 1 | 238.98 | | Weekly Target 2 | 254.47 | | Weekly Target 3 | 276.73333333333 | | Weekly Target 4 | 292.22 | | Weekly Target 5 | 314.48 |
Weekly price and volumes for Uttam Sugar
| Date |
Closing |
Open |
Range |
Volume |
Wed 03 September 2025 |
269.95 (0.04%) |
269.85 |
261.25 - 299.00 |
6.6449 times |
Fri 29 August 2025 |
269.85 (2.39%) |
264.75 |
257.60 - 283.80 |
0.2096 times |
Fri 22 August 2025 |
263.55 (7.79%) |
238.05 |
238.05 - 269.05 |
0.6947 times |
Thu 14 August 2025 |
244.50 (1.07%) |
239.75 |
235.60 - 260.95 |
0.6526 times |
Fri 08 August 2025 |
241.90 (-6.71%) |
274.80 |
235.20 - 274.80 |
0.6065 times |
Fri 01 August 2025 |
259.30 (-3.87%) |
266.40 |
255.00 - 273.85 |
0.5792 times |
Fri 25 July 2025 |
269.75 (-5.27%) |
280.00 |
267.70 - 286.80 |
0.265 times |
Fri 18 July 2025 |
284.75 (-1.13%) |
275.00 |
275.00 - 295.65 |
0.0868 times |
Fri 11 July 2025 |
288.00 (-0.89%) |
290.60 |
287.25 - 302.40 |
0.1258 times |
Fri 04 July 2025 |
290.60 (-3.47%) |
298.10 |
289.05 - 302.55 |
0.1351 times |
Fri 27 June 2025 |
301.05 (6.57%) |
293.95 |
288.35 - 309.00 |
0.2869 times |

Monthly price and charts UttamSugar Strong monthly Stock price targets for UttamSugar 532729 are 265.6 and 303.35 | Monthly Target 1 | 238.98 | | Monthly Target 2 | 254.47 | | Monthly Target 3 | 276.73333333333 | | Monthly Target 4 | 292.22 | | Monthly Target 5 | 314.48 |
Monthly price and volumes Uttam Sugar
| Date |
Closing |
Open |
Range |
Volume |
Wed 03 September 2025 |
269.95 (0.04%) |
269.85 |
261.25 - 299.00 |
1.6763 times |
Fri 29 August 2025 |
269.85 (3.19%) |
261.60 |
235.20 - 283.80 |
0.5937 times |
Thu 31 July 2025 |
261.50 (-13.24%) |
302.55 |
258.00 - 302.55 |
0.2405 times |
Mon 30 June 2025 |
301.40 (-1.95%) |
307.05 |
277.90 - 326.15 |
0.5529 times |
Fri 30 May 2025 |
307.40 (8.24%) |
289.80 |
261.00 - 330.70 |
1.2006 times |
Wed 30 April 2025 |
284.00 (9.86%) |
257.00 |
247.50 - 316.00 |
0.505 times |
Fri 28 March 2025 |
258.50 (39.24%) |
186.35 |
170.05 - 269.00 |
2.0936 times |
Fri 28 February 2025 |
185.65 (-16.6%) |
220.55 |
183.00 - 225.35 |
1.42 times |
Fri 31 January 2025 |
222.60 (-14.55%) |
265.00 |
201.70 - 268.75 |
0.9157 times |
Tue 31 December 2024 |
260.50 (-11.72%) |
300.00 |
255.00 - 304.00 |
0.8018 times |
Fri 29 November 2024 |
295.10 (-8.6%) |
325.00 |
272.05 - 327.05 |
0.4863 times |

DMA SMA EMA moving averages of Uttam Sugar 532729
DMA (daily moving average) of Uttam Sugar 532729
| DMA period | DMA value | | 5 day DMA | 269.28 | | 12 day DMA | 263.68 | | 20 day DMA | 256.54 | | 35 day DMA | 264.6 | | 50 day DMA | 273.57 | | 100 day DMA | 285.53 | | 150 day DMA | 261.8 | | 200 day DMA | 265.72 | EMA (exponential moving average) of Uttam Sugar 532729
| EMA period | EMA current | EMA prev | EMA prev2 | | 5 day EMA | 267.88 | 266.85 | 266.17 | | 12 day EMA | 264.48 | 263.48 | 262.62 | | 20 day EMA | 263.62 | 262.95 | 262.4 | | 35 day EMA | 267.98 | 267.86 | 267.84 | | 50 day EMA | 274.57 | 274.76 | 275.03 |
SMA (simple moving average) of Uttam Sugar 532729
| SMA period | SMA current | SMA prev | SMA prev2 | | 5 day SMA | 269.28 | 267.91 | 267.48 | | 12 day SMA | 263.68 | 261.55 | 260.05 | | 20 day SMA | 256.54 | 255.98 | 255.54 | | 35 day SMA | 264.6 | 265.07 | 265.63 | | 50 day SMA | 273.57 | 274.07 | 274.36 | | 100 day SMA | 285.53 | 285.53 | 285.48 | | 150 day SMA | 261.8 | 261.54 | 261.22 | | 200 day SMA | 265.72 | 265.94 | 266.22 |
|
|
