GallanMetal 532726 full analysis,charts,indicators,moving averages,SMA,DMA,EMA,ADX,MACD,RSIGallan Metal 532726 WideScreen charts, DMA,SMA,EMA technical analysis, forecast prediction, by indicators ADX,MACD,RSI,CCI BSE stock exchange
Daily price and charts and targets GallanMetal Strong Daily Stock price targets for GallanMetal 532726 are 610.75 and 633 | Daily Target 1 | 593.55 | | Daily Target 2 | 605.7 | | Daily Target 3 | 615.8 | | Daily Target 4 | 627.95 | | Daily Target 5 | 638.05 |
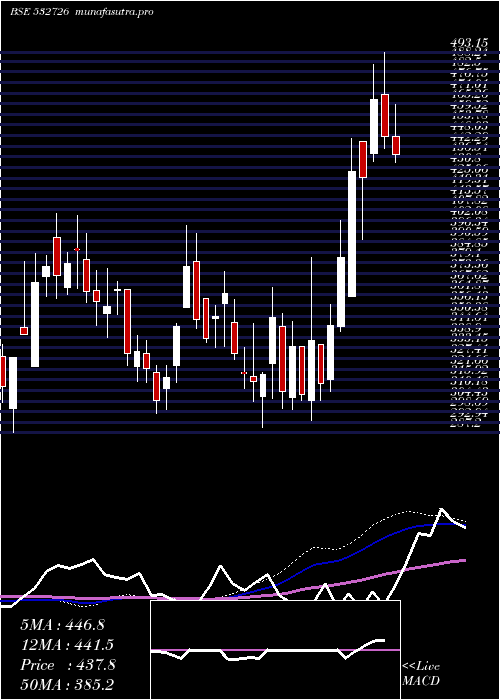
Daily price and volume Gallan Metal
| Date |
Closing |
Open |
Range |
Volume |
Wed 03 September 2025 |
617.85 (1.65%) |
607.85 |
603.65 - 625.90 |
0.5551 times |
Tue 02 September 2025 |
607.85 (3.02%) |
590.05 |
589.00 - 636.65 |
1.7716 times |
Mon 01 September 2025 |
590.05 (2.66%) |
586.00 |
576.05 - 594.65 |
0.3948 times |
Fri 29 August 2025 |
574.75 (-1.15%) |
581.10 |
572.90 - 590.75 |
2.0502 times |
Thu 28 August 2025 |
581.45 (-3.32%) |
590.35 |
575.25 - 603.40 |
0.6288 times |
Tue 26 August 2025 |
601.40 (-2.69%) |
637.95 |
601.00 - 637.95 |
0.3702 times |
Mon 25 August 2025 |
618.00 (0.3%) |
611.00 |
611.00 - 642.10 |
1.5969 times |
Fri 22 August 2025 |
616.15 (-1.96%) |
623.10 |
609.80 - 633.50 |
0.796 times |
Thu 21 August 2025 |
628.50 (-1.15%) |
629.70 |
625.00 - 642.45 |
0.7787 times |
Wed 20 August 2025 |
635.80 (2.54%) |
617.55 |
617.50 - 643.15 |
1.0577 times |
Tue 19 August 2025 |
620.05 (-3.4%) |
641.10 |
617.20 - 642.05 |
1.9238 times |

Weekly price and charts GallanMetal Strong weekly Stock price targets for GallanMetal 532726 are 596.95 and 657.55 | Weekly Target 1 | 549.58 | | Weekly Target 2 | 583.72 | | Weekly Target 3 | 610.18333333333 | | Weekly Target 4 | 644.32 | | Weekly Target 5 | 670.78 |
Weekly price and volumes for Gallan Metal
| Date |
Closing |
Open |
Range |
Volume |
Wed 03 September 2025 |
617.85 (7.5%) |
586.00 |
576.05 - 636.65 |
0.3585 times |
Fri 29 August 2025 |
574.75 (-6.72%) |
611.00 |
572.90 - 642.10 |
0.612 times |
Fri 22 August 2025 |
616.15 (-6.02%) |
652.15 |
609.80 - 665.75 |
1.09 times |
Thu 14 August 2025 |
655.60 (-13.66%) |
759.30 |
652.00 - 788.80 |
0.9807 times |
Fri 08 August 2025 |
759.35 (0.38%) |
758.15 |
752.00 - 800.60 |
1.0272 times |
Fri 01 August 2025 |
756.50 (19.33%) |
667.40 |
643.60 - 786.05 |
2.346 times |
Fri 25 July 2025 |
633.95 (8.46%) |
599.95 |
589.00 - 654.45 |
1.155 times |
Fri 18 July 2025 |
584.50 (0.03%) |
583.00 |
563.75 - 604.65 |
0.4305 times |
Fri 11 July 2025 |
584.30 (6.76%) |
548.05 |
533.00 - 609.55 |
1.0345 times |
Fri 04 July 2025 |
547.30 (4.44%) |
526.55 |
519.75 - 577.85 |
0.9654 times |
Fri 27 June 2025 |
524.05 (11.44%) |
504.30 |
490.15 - 567.65 |
1.7465 times |
Monthly price and charts GallanMetal Strong monthly Stock price targets for GallanMetal 532726 are 596.95 and 657.55 | Monthly Target 1 | 549.58 | | Monthly Target 2 | 583.72 | | Monthly Target 3 | 610.18333333333 | | Monthly Target 4 | 644.32 | | Monthly Target 5 | 670.78 |
Monthly price and volumes Gallan Metal
| Date |
Closing |
Open |
Range |
Volume |
Wed 03 September 2025 |
617.85 (7.5%) |
586.00 |
576.05 - 636.65 |
0.2039 times |
Fri 29 August 2025 |
574.75 (-25.07%) |
761.25 |
572.90 - 800.60 |
2.2995 times |
Thu 31 July 2025 |
767.10 (44.06%) |
535.85 |
519.75 - 783.25 |
3.1747 times |
Mon 30 June 2025 |
532.50 (14.2%) |
474.00 |
422.15 - 567.65 |
1.5464 times |
Fri 30 May 2025 |
466.30 (6.52%) |
422.20 |
397.30 - 506.50 |
0.5222 times |
Wed 30 April 2025 |
437.75 (14.62%) |
361.05 |
361.05 - 493.15 |
1.2648 times |
Fri 28 March 2025 |
381.90 (23.97%) |
304.70 |
293.75 - 402.00 |
0.499 times |
Fri 28 February 2025 |
308.05 (-3.33%) |
325.00 |
299.75 - 365.95 |
0.1894 times |
Fri 31 January 2025 |
318.65 (-7.98%) |
345.00 |
290.10 - 374.40 |
0.1387 times |
Tue 31 December 2024 |
346.30 (0.38%) |
355.00 |
333.20 - 399.35 |
0.1613 times |
Fri 29 November 2024 |
345.00 (4.86%) |
330.00 |
297.50 - 346.25 |
0.2479 times |

DMA SMA EMA moving averages of Gallan Metal 532726
DMA (daily moving average) of Gallan Metal 532726
| DMA period | DMA value | | 5 day DMA | 594.39 | | 12 day DMA | 611.15 | | 20 day DMA | 663.93 | | 35 day DMA | 663.26 | | 50 day DMA | 628.69 | | 100 day DMA | 541.8 | | 150 day DMA | 470.84 | | 200 day DMA | 437.92 | EMA (exponential moving average) of Gallan Metal 532726
| EMA period | EMA current | EMA prev | EMA prev2 | | 5 day EMA | 605.2 | 598.88 | 594.4 | | 12 day EMA | 620.82 | 621.36 | 623.81 | | 20 day EMA | 634.69 | 636.46 | 639.47 | | 35 day EMA | 625.31 | 625.75 | 626.8 | | 50 day EMA | 612.36 | 612.14 | 612.32 |
SMA (simple moving average) of Gallan Metal 532726
| SMA period | SMA current | SMA prev | SMA prev2 | | 5 day SMA | 594.39 | 591.1 | 593.13 | | 12 day SMA | 611.15 | 614.29 | 622.72 | | 20 day SMA | 663.93 | 672.29 | 679.73 | | 35 day SMA | 663.26 | 662.02 | 661.35 | | 50 day SMA | 628.69 | 626.83 | 624.08 | | 100 day SMA | 541.8 | 539.89 | 537.89 | | 150 day SMA | 470.84 | 468.87 | 466.92 | | 200 day SMA | 437.92 | 436.45 | 435.07 |
|
|
