Indotechtr 532717 full analysis,charts,indicators,moving averages,SMA,DMA,EMA,ADX,MACD,RSIIndotechtr 532717 WideScreen charts, DMA,SMA,EMA technical analysis, forecast prediction, by indicators ADX,MACD,RSI,CCI BSE stock exchange
Daily price and charts and targets Indotechtr Strong Daily Stock price targets for Indotechtr 532717 are 1671.8 and 1755.25 | Daily Target 1 | 1655.38 | | Daily Target 2 | 1688.22 | | Daily Target 3 | 1738.8333333333 | | Daily Target 4 | 1771.67 | | Daily Target 5 | 1822.28 |
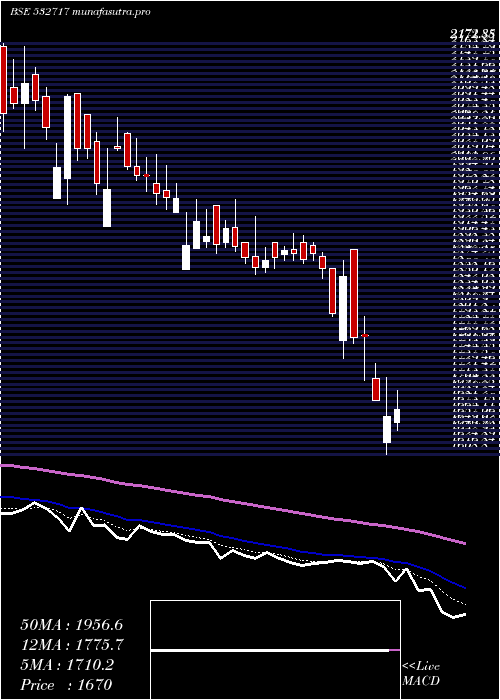
Daily price and volume Indotechtr
| Date |
Closing |
Open |
Range |
Volume |
Thu 23 October 2025 |
1721.05 (-0.39%) |
1789.45 |
1706.00 - 1789.45 |
0.6857 times |
Tue 21 October 2025 |
1727.80 (1.69%) |
1731.95 |
1677.20 - 1740.00 |
0.4949 times |
Mon 20 October 2025 |
1699.15 (0.46%) |
1662.00 |
1662.00 - 1722.25 |
0.431 times |
Fri 17 October 2025 |
1691.45 (-1.6%) |
1725.00 |
1660.40 - 1725.00 |
1.238 times |
Thu 16 October 2025 |
1719.00 (-2.49%) |
1758.10 |
1700.00 - 1770.00 |
1.018 times |
Wed 15 October 2025 |
1762.95 (-0.24%) |
1767.15 |
1755.00 - 1773.00 |
0.8345 times |
Tue 14 October 2025 |
1767.15 (-1.63%) |
1780.00 |
1759.00 - 1814.65 |
0.4973 times |
Mon 13 October 2025 |
1796.45 (-1.62%) |
1969.95 |
1791.65 - 1969.95 |
0.4706 times |
Fri 10 October 2025 |
1826.00 (1.67%) |
1796.05 |
1782.25 - 1850.00 |
1.9673 times |
Thu 09 October 2025 |
1796.05 (-0.94%) |
1813.25 |
1737.40 - 1828.95 |
2.3627 times |
Wed 08 October 2025 |
1813.05 (-3.24%) |
1873.85 |
1798.55 - 1886.95 |
0.9913 times |
Weekly price and charts Indotechtr Strong weekly Stock price targets for Indotechtr 532717 are 1691.53 and 1818.98 | Weekly Target 1 | 1596.72 | | Weekly Target 2 | 1658.88 | | Weekly Target 3 | 1724.1666666667 | | Weekly Target 4 | 1786.33 | | Weekly Target 5 | 1851.62 |
Weekly price and volumes for Indotechtr
| Date |
Closing |
Open |
Range |
Volume |
Thu 23 October 2025 |
1721.05 (1.75%) |
1662.00 |
1662.00 - 1789.45 |
0.1773 times |
Fri 17 October 2025 |
1691.45 (-7.37%) |
1969.95 |
1660.40 - 1969.95 |
0.4465 times |
Fri 10 October 2025 |
1826.00 (1.12%) |
1837.95 |
1737.40 - 1912.25 |
1.3857 times |
Fri 03 October 2025 |
1805.80 (5.9%) |
1710.00 |
1616.75 - 1809.65 |
0.8828 times |
Fri 26 September 2025 |
1705.25 (-6.11%) |
1824.35 |
1696.55 - 1830.00 |
0.6416 times |
Fri 19 September 2025 |
1816.25 (1.96%) |
1781.90 |
1745.00 - 1845.70 |
0.6269 times |
Fri 12 September 2025 |
1781.35 (-2.44%) |
1879.95 |
1753.75 - 1879.95 |
0.8919 times |
Fri 05 September 2025 |
1825.90 (5.36%) |
1710.05 |
1700.00 - 1930.50 |
2.1062 times |
Fri 29 August 2025 |
1733.05 (-7.21%) |
1850.25 |
1705.25 - 1864.05 |
1.1287 times |
Fri 22 August 2025 |
1867.80 (-1.92%) |
1999.50 |
1832.55 - 1999.50 |
1.7124 times |
Thu 14 August 2025 |
1904.30 (21.54%) |
1555.40 |
1545.20 - 1904.30 |
0.226 times |

Monthly price and charts Indotechtr Strong monthly Stock price targets for Indotechtr 532717 are 1681.53 and 2009.48 | Monthly Target 1 | 1449.72 | | Monthly Target 2 | 1585.38 | | Monthly Target 3 | 1777.6666666667 | | Monthly Target 4 | 1913.33 | | Monthly Target 5 | 2105.62 |
Monthly price and volumes Indotechtr
| Date |
Closing |
Open |
Range |
Volume |
Thu 23 October 2025 |
1721.05 (3.99%) |
1642.00 |
1642.00 - 1969.95 |
0.2536 times |
Tue 30 September 2025 |
1655.00 (-4.5%) |
1710.05 |
1616.75 - 1930.50 |
0.4408 times |
Fri 29 August 2025 |
1733.05 (4.39%) |
1651.75 |
1540.00 - 1999.50 |
0.442 times |
Thu 31 July 2025 |
1660.10 (-15.56%) |
1970.05 |
1608.80 - 2005.00 |
0.7263 times |
Mon 30 June 2025 |
1966.00 (0.78%) |
1917.00 |
1915.00 - 2231.00 |
0.8676 times |
Fri 30 May 2025 |
1950.70 (-14.4%) |
2300.00 |
1919.70 - 2790.15 |
1.9466 times |
Wed 30 April 2025 |
2278.85 (1.24%) |
2230.00 |
1980.40 - 2746.10 |
1.4159 times |
Fri 28 March 2025 |
2251.00 (11.37%) |
1931.15 |
1920.20 - 2520.00 |
1.7859 times |
Fri 28 February 2025 |
2021.25 (-20.37%) |
2465.10 |
1821.95 - 2678.75 |
1.362 times |
Fri 31 January 2025 |
2538.40 (-12.54%) |
3047.35 |
2458.00 - 3792.90 |
0.7592 times |
Tue 31 December 2024 |
2902.25 (9.64%) |
2630.90 |
2550.00 - 3285.10 |
0.5053 times |

DMA SMA EMA moving averages of Indotechtr 532717
DMA (daily moving average) of Indotechtr 532717
| DMA period | DMA value | | 5 day DMA | 1711.69 | | 12 day DMA | 1766.16 | | 20 day DMA | 1757.96 | | 35 day DMA | 1771.26 | | 50 day DMA | 1787.67 | | 100 day DMA | 1846.95 | | 150 day DMA | 1991.57 | | 200 day DMA | 2163.04 | EMA (exponential moving average) of Indotechtr 532717
| EMA period | EMA current | EMA prev | EMA prev2 | | 5 day EMA | 1724.55 | 1726.3 | 1725.55 | | 12 day EMA | 1744.98 | 1749.33 | 1753.24 | | 20 day EMA | 1755.22 | 1758.82 | 1762.08 | | 35 day EMA | 1762.5 | 1764.94 | 1767.13 | | 50 day EMA | 1765.26 | 1767.06 | 1768.66 |
SMA (simple moving average) of Indotechtr 532717
| SMA period | SMA current | SMA prev | SMA prev2 | | 5 day SMA | 1711.69 | 1720.07 | 1727.94 | | 12 day SMA | 1766.16 | 1779.19 | 1785.69 | | 20 day SMA | 1757.96 | 1760.9 | 1763.35 | | 35 day SMA | 1771.26 | 1776.67 | 1779.3 | | 50 day SMA | 1787.67 | 1784.58 | 1781.95 | | 100 day SMA | 1846.95 | 1849.95 | 1853.94 | | 150 day SMA | 1991.57 | 1995.67 | 1999.52 | | 200 day SMA | 2163.04 | 2169.46 | 2175.67 |
|
|
