SakumaExpo 532713 full analysis,charts,indicators,moving averages,SMA,DMA,EMA,ADX,MACD,RSISakuma Expo 532713 WideScreen charts, DMA,SMA,EMA technical analysis, forecast prediction, by indicators ADX,MACD,RSI,CCI BSE stock exchange
Daily price and charts and targets SakumaExpo Strong Daily Stock price targets for SakumaExpo 532713 are 2.58 and 2.77 | Daily Target 1 | 2.54 | | Daily Target 2 | 2.61 | | Daily Target 3 | 2.7266666666667 | | Daily Target 4 | 2.8 | | Daily Target 5 | 2.92 |
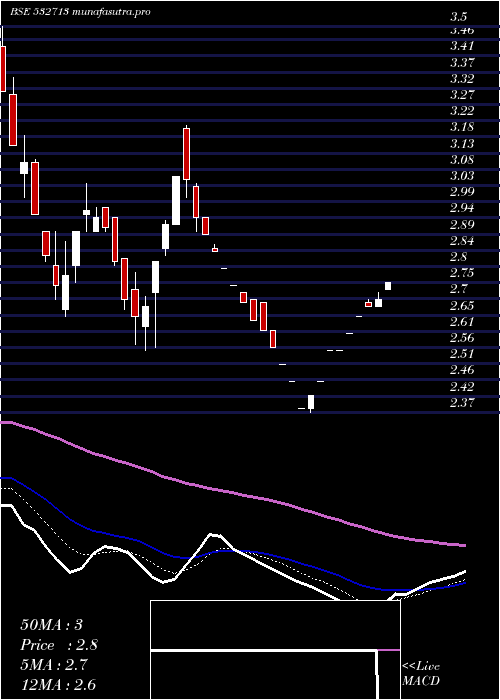
Daily price and volume Sakuma Expo
| Date |
Closing |
Open |
Range |
Volume |
Wed 03 September 2025 |
2.69 (2.28%) |
2.84 |
2.65 - 2.84 |
1.1618 times |
Tue 02 September 2025 |
2.63 (4.37%) |
2.53 |
2.51 - 2.65 |
0.7992 times |
Mon 01 September 2025 |
2.52 (-0.79%) |
2.54 |
2.51 - 2.57 |
0.8882 times |
Fri 29 August 2025 |
2.54 (-1.55%) |
2.55 |
2.52 - 2.57 |
0.814 times |
Thu 28 August 2025 |
2.58 (-1.53%) |
2.61 |
2.56 - 2.64 |
0.5203 times |
Tue 26 August 2025 |
2.62 (-0.76%) |
2.66 |
2.60 - 2.66 |
0.7022 times |
Mon 25 August 2025 |
2.64 (-1.12%) |
2.71 |
2.63 - 2.71 |
0.5786 times |
Fri 22 August 2025 |
2.67 (-1.11%) |
2.70 |
2.63 - 2.70 |
0.6411 times |
Thu 21 August 2025 |
2.70 (-2.17%) |
2.79 |
2.69 - 2.79 |
0.9846 times |
Wed 20 August 2025 |
2.76 (6.98%) |
2.59 |
2.55 - 2.81 |
2.9099 times |
Tue 19 August 2025 |
2.58 (1.57%) |
2.53 |
2.52 - 2.58 |
0.6823 times |
Weekly price and charts SakumaExpo Strong weekly Stock price targets for SakumaExpo 532713 are 2.6 and 2.93 | Weekly Target 1 | 2.35 | | Weekly Target 2 | 2.52 | | Weekly Target 3 | 2.68 | | Weekly Target 4 | 2.85 | | Weekly Target 5 | 3.01 |
Weekly price and volumes for Sakuma Expo
| Date |
Closing |
Open |
Range |
Volume |
Wed 03 September 2025 |
2.69 (5.91%) |
2.54 |
2.51 - 2.84 |
0.67 times |
Fri 29 August 2025 |
2.54 (-4.87%) |
2.71 |
2.52 - 2.71 |
0.615 times |
Fri 22 August 2025 |
2.67 (6.8%) |
2.53 |
2.50 - 2.81 |
1.4857 times |
Thu 14 August 2025 |
2.50 (-6.02%) |
2.67 |
2.46 - 2.77 |
1.58 times |
Fri 08 August 2025 |
2.66 (-1.12%) |
2.71 |
2.60 - 2.83 |
1.3661 times |
Fri 01 August 2025 |
2.69 (-5.28%) |
2.79 |
2.65 - 2.91 |
0.9255 times |
Fri 25 July 2025 |
2.84 (-1.39%) |
2.86 |
2.75 - 2.96 |
0.7656 times |
Fri 18 July 2025 |
2.88 (-2.04%) |
2.94 |
2.86 - 3.01 |
1.0491 times |
Fri 11 July 2025 |
2.94 (-2%) |
3.00 |
2.93 - 3.02 |
0.8932 times |
Fri 04 July 2025 |
3.00 (-1.64%) |
3.05 |
2.98 - 3.07 |
0.6498 times |
Fri 27 June 2025 |
3.05 (0%) |
2.91 |
2.91 - 3.12 |
0.8917 times |

Monthly price and charts SakumaExpo Strong monthly Stock price targets for SakumaExpo 532713 are 2.6 and 2.93 | Monthly Target 1 | 2.35 | | Monthly Target 2 | 2.52 | | Monthly Target 3 | 2.68 | | Monthly Target 4 | 2.85 | | Monthly Target 5 | 3.01 |
Monthly price and volumes Sakuma Expo
| Date |
Closing |
Open |
Range |
Volume |
Wed 03 September 2025 |
2.69 (5.91%) |
2.54 |
2.51 - 2.84 |
0.1584 times |
Fri 29 August 2025 |
2.54 (-6.27%) |
2.75 |
2.46 - 2.83 |
1.2159 times |
Thu 31 July 2025 |
2.71 (-10.86%) |
3.02 |
2.67 - 3.06 |
0.9637 times |
Mon 30 June 2025 |
3.04 (-1.94%) |
3.10 |
2.91 - 3.65 |
1.4316 times |
Fri 30 May 2025 |
3.10 (-17.33%) |
3.68 |
2.90 - 3.68 |
0.753 times |
Wed 30 April 2025 |
3.75 (57.56%) |
2.38 |
2.37 - 3.82 |
1.0344 times |
Fri 28 March 2025 |
2.38 (-11.85%) |
2.73 |
2.38 - 3.21 |
0.8393 times |
Fri 28 February 2025 |
2.70 (-23.3%) |
3.61 |
2.65 - 3.65 |
1.2038 times |
Fri 31 January 2025 |
3.52 (-9.28%) |
3.93 |
3.35 - 4.00 |
1.0344 times |
Tue 31 December 2024 |
3.88 (-7.4%) |
4.19 |
3.71 - 4.23 |
1.3654 times |
Fri 29 November 2024 |
4.19 (3.46%) |
4.11 |
3.73 - 4.51 |
1.7369 times |

DMA SMA EMA moving averages of Sakuma Expo 532713
DMA (daily moving average) of Sakuma Expo 532713
| DMA period | DMA value | | 5 day DMA | 2.59 | | 12 day DMA | 2.62 | | 20 day DMA | 2.63 | | 35 day DMA | 2.72 | | 50 day DMA | 2.81 | | 100 day DMA | 2.98 | | 150 day DMA | 3.01 | | 200 day DMA | 3.25 | EMA (exponential moving average) of Sakuma Expo 532713
| EMA period | EMA current | EMA prev | EMA prev2 | | 5 day EMA | 2.62 | 2.59 | 2.57 | | 12 day EMA | 2.62 | 2.61 | 2.61 | | 20 day EMA | 2.66 | 2.66 | 2.66 | | 35 day EMA | 2.72 | 2.72 | 2.73 | | 50 day EMA | 2.81 | 2.81 | 2.82 |
SMA (simple moving average) of Sakuma Expo 532713
| SMA period | SMA current | SMA prev | SMA prev2 | | 5 day SMA | 2.59 | 2.58 | 2.58 | | 12 day SMA | 2.62 | 2.61 | 2.61 | | 20 day SMA | 2.63 | 2.63 | 2.64 | | 35 day SMA | 2.72 | 2.73 | 2.74 | | 50 day SMA | 2.81 | 2.81 | 2.82 | | 100 day SMA | 2.98 | 2.97 | 2.97 | | 150 day SMA | 3.01 | 3.02 | 3.02 | | 200 day SMA | 3.25 | 3.26 | 3.27 |
|
|
