Sasken 532663 full analysis,charts,indicators,moving averages,SMA,DMA,EMA,ADX,MACD,RSISasken 532663 WideScreen charts, DMA,SMA,EMA technical analysis, forecast prediction, by indicators ADX,MACD,RSI,CCI BSE stock exchange
Daily price and charts and targets Sasken Strong Daily Stock price targets for Sasken 532663 are 1393.5 and 1406.5 | Daily Target 1 | 1382.67 | | Daily Target 2 | 1391.33 | | Daily Target 3 | 1395.6666666667 | | Daily Target 4 | 1404.33 | | Daily Target 5 | 1408.67 |
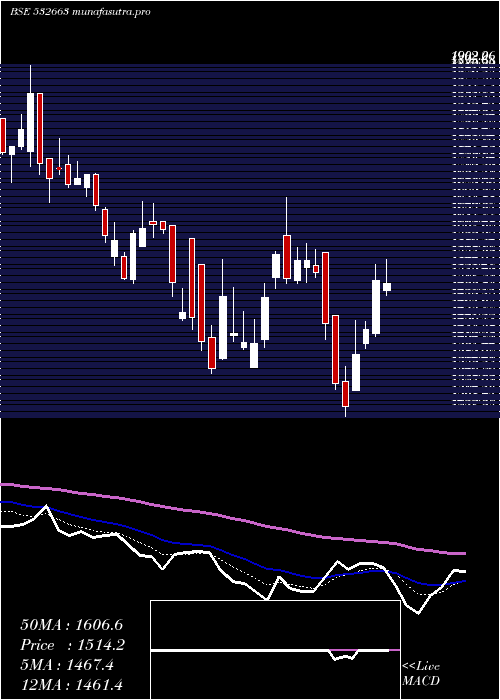
Daily price and volume Sasken
| Date |
Closing |
Open |
Range |
Volume |
Tue 21 October 2025 |
1400.00 (0.89%) |
1387.00 |
1387.00 - 1400.00 |
0.1341 times |
Mon 20 October 2025 |
1387.60 (0.79%) |
1381.60 |
1381.60 - 1390.00 |
0.0511 times |
Fri 17 October 2025 |
1376.75 (-1.78%) |
1397.55 |
1376.75 - 1403.00 |
0.2012 times |
Thu 16 October 2025 |
1401.70 (2.46%) |
1392.00 |
1379.70 - 1402.65 |
1.2105 times |
Wed 15 October 2025 |
1368.05 (0.11%) |
1363.40 |
1362.00 - 1376.15 |
0.5781 times |
Tue 14 October 2025 |
1366.50 (-1.24%) |
1390.00 |
1340.00 - 1390.00 |
1.3989 times |
Mon 13 October 2025 |
1383.65 (-0.95%) |
1402.00 |
1381.00 - 1416.10 |
0.5398 times |
Fri 10 October 2025 |
1396.90 (1.39%) |
1377.70 |
1377.70 - 1418.80 |
2.0473 times |
Thu 09 October 2025 |
1377.70 (1.21%) |
1373.80 |
1367.10 - 1377.70 |
0.0767 times |
Wed 08 October 2025 |
1361.25 (-0.83%) |
1369.05 |
1355.40 - 1377.55 |
3.7624 times |
Tue 07 October 2025 |
1372.60 (-0.54%) |
1382.50 |
1370.00 - 1386.55 |
1.4053 times |
Weekly price and charts Sasken Strong weekly Stock price targets for Sasken 532663 are 1390.8 and 1409.2 | Weekly Target 1 | 1375.47 | | Weekly Target 2 | 1387.73 | | Weekly Target 3 | 1393.8666666667 | | Weekly Target 4 | 1406.13 | | Weekly Target 5 | 1412.27 |
Weekly price and volumes for Sasken
| Date |
Closing |
Open |
Range |
Volume |
Tue 21 October 2025 |
1400.00 (1.69%) |
1381.60 |
1381.60 - 1400.00 |
0.0143 times |
Fri 17 October 2025 |
1376.75 (-1.44%) |
1402.00 |
1340.00 - 1416.10 |
0.3042 times |
Fri 10 October 2025 |
1396.90 (0.93%) |
1390.30 |
1355.40 - 1418.80 |
0.722 times |
Fri 03 October 2025 |
1384.05 (-0.56%) |
1435.50 |
1358.90 - 1435.50 |
0.5279 times |
Fri 26 September 2025 |
1391.90 (-7.03%) |
1549.95 |
1385.35 - 1549.95 |
1.4839 times |
Fri 19 September 2025 |
1497.15 (0.18%) |
1483.55 |
1462.60 - 1631.20 |
0.9924 times |
Fri 12 September 2025 |
1494.40 (5.01%) |
1457.20 |
1457.20 - 1560.65 |
2.1784 times |
Fri 05 September 2025 |
1423.15 (-1.74%) |
1468.30 |
1409.10 - 1490.00 |
0.6683 times |
Fri 29 August 2025 |
1448.30 (1.06%) |
1432.80 |
1386.60 - 1514.95 |
0.5645 times |
Fri 22 August 2025 |
1433.15 (-4.39%) |
1499.00 |
1426.00 - 1629.80 |
2.544 times |
Thu 14 August 2025 |
1498.95 (4.28%) |
1437.00 |
1430.05 - 1529.95 |
0.7042 times |

Monthly price and charts Sasken Strong monthly Stock price targets for Sasken 532663 are 1370 and 1448.8 | Monthly Target 1 | 1307.47 | | Monthly Target 2 | 1353.73 | | Monthly Target 3 | 1386.2666666667 | | Monthly Target 4 | 1432.53 | | Monthly Target 5 | 1465.07 |
Monthly price and volumes Sasken
| Date |
Closing |
Open |
Range |
Volume |
Tue 21 October 2025 |
1400.00 (2.06%) |
1378.20 |
1340.00 - 1418.80 |
0.2638 times |
Tue 30 September 2025 |
1371.70 (-5.29%) |
1468.30 |
1358.90 - 1631.20 |
1.2563 times |
Fri 29 August 2025 |
1448.30 (-2.67%) |
1492.95 |
1386.60 - 1629.80 |
1.0073 times |
Thu 31 July 2025 |
1488.00 (2.06%) |
1465.05 |
1410.05 - 1587.60 |
1.0804 times |
Mon 30 June 2025 |
1457.95 (-4.99%) |
1529.00 |
1378.10 - 1546.65 |
1.0619 times |
Fri 30 May 2025 |
1534.60 (-0.26%) |
1525.65 |
1372.80 - 1677.95 |
1.1517 times |
Wed 30 April 2025 |
1538.65 (-1.01%) |
1542.10 |
1276.55 - 1710.25 |
1.0491 times |
Fri 28 March 2025 |
1554.40 (-2.26%) |
1562.50 |
1353.55 - 1667.25 |
1.8035 times |
Fri 28 February 2025 |
1590.35 (-20.56%) |
1952.60 |
1546.00 - 1970.40 |
0.3926 times |
Fri 31 January 2025 |
2001.85 (-5.56%) |
2128.05 |
1681.10 - 2212.50 |
0.9333 times |
Tue 31 December 2024 |
2119.60 (-3.24%) |
2274.95 |
2035.95 - 2365.55 |
1.8178 times |

DMA SMA EMA moving averages of Sasken 532663
DMA (daily moving average) of Sasken 532663
| DMA period | DMA value | | 5 day DMA | 1386.82 | | 12 day DMA | 1381.06 | | 20 day DMA | 1393.17 | | 35 day DMA | 1432.01 | | 50 day DMA | 1439.96 | | 100 day DMA | 1453.19 | | 150 day DMA | 1464.27 | | 200 day DMA | 1576.31 | EMA (exponential moving average) of Sasken 532663
| EMA period | EMA current | EMA prev | EMA prev2 | | 5 day EMA | 1388.97 | 1383.46 | 1381.39 | | 12 day EMA | 1389.92 | 1388.09 | 1388.18 | | 20 day EMA | 1400.25 | 1400.28 | 1401.61 | | 35 day EMA | 1414.8 | 1415.67 | 1417.32 | | 50 day EMA | 1436.54 | 1438.03 | 1440.09 |
SMA (simple moving average) of Sasken 532663
| SMA period | SMA current | SMA prev | SMA prev2 | | 5 day SMA | 1386.82 | 1380.12 | 1379.33 | | 12 day SMA | 1381.06 | 1379.73 | 1381.73 | | 20 day SMA | 1393.17 | 1398.39 | 1403.87 | | 35 day SMA | 1432.01 | 1433.01 | 1434.75 | | 50 day SMA | 1439.96 | 1441.25 | 1442.41 | | 100 day SMA | 1453.19 | 1454.36 | 1455.22 | | 150 day SMA | 1464.27 | 1465.69 | 1467.12 | | 200 day SMA | 1576.31 | 1579.71 | 1583.18 |
|
|
