RaneMadras 532661 full analysis,charts,indicators,moving averages,SMA,DMA,EMA,ADX,MACD,RSIRane Madras 532661 WideScreen charts, DMA,SMA,EMA technical analysis, forecast prediction, by indicators ADX,MACD,RSI,CCI BSE stock exchange
Daily price and charts and targets RaneMadras Strong Daily Stock price targets for RaneMadras 532661 are 819.38 and 824.58 | Daily Target 1 | 818.08 | | Daily Target 2 | 820.67 | | Daily Target 3 | 823.28333333333 | | Daily Target 4 | 825.87 | | Daily Target 5 | 828.48 |
Daily price and volume Rane Madras
| Date |
Closing |
Open |
Range |
Volume |
Tue 21 October 2025 |
823.25 (0.31%) |
824.40 |
820.70 - 825.90 |
0.3443 times |
Mon 20 October 2025 |
820.70 (1.06%) |
820.70 |
812.75 - 822.00 |
4.9134 times |
Fri 17 October 2025 |
812.10 (-0.84%) |
820.85 |
808.00 - 823.20 |
0.4241 times |
Thu 16 October 2025 |
818.95 (-1.06%) |
823.80 |
817.55 - 826.70 |
0.2308 times |
Wed 15 October 2025 |
827.75 (0.58%) |
826.35 |
822.05 - 830.00 |
0.6742 times |
Tue 14 October 2025 |
823.00 (-0.86%) |
827.75 |
813.40 - 833.10 |
1.4772 times |
Mon 13 October 2025 |
830.15 (0.11%) |
827.00 |
822.65 - 834.95 |
0.3703 times |
Fri 10 October 2025 |
829.20 (-1.22%) |
842.65 |
826.30 - 849.25 |
0.8886 times |
Thu 09 October 2025 |
839.40 (0.42%) |
856.70 |
820.50 - 856.70 |
0.2058 times |
Wed 08 October 2025 |
835.85 (-0.67%) |
842.30 |
830.00 - 846.90 |
0.4712 times |
Tue 07 October 2025 |
841.50 (0.86%) |
839.05 |
834.95 - 853.00 |
0.9511 times |
Weekly price and charts RaneMadras Strong weekly Stock price targets for RaneMadras 532661 are 818 and 831.15 | Weekly Target 1 | 807.48 | | Weekly Target 2 | 815.37 | | Weekly Target 3 | 820.63333333333 | | Weekly Target 4 | 828.52 | | Weekly Target 5 | 833.78 |
Weekly price and volumes for Rane Madras
| Date |
Closing |
Open |
Range |
Volume |
Tue 21 October 2025 |
823.25 (1.37%) |
820.70 |
812.75 - 825.90 |
1.055 times |
Fri 17 October 2025 |
812.10 (-2.06%) |
827.00 |
808.00 - 834.95 |
0.6374 times |
Fri 10 October 2025 |
829.20 (-1.15%) |
809.30 |
809.30 - 856.70 |
0.5264 times |
Fri 03 October 2025 |
838.85 (2.57%) |
817.80 |
811.00 - 842.15 |
0.1868 times |
Fri 26 September 2025 |
817.80 (-3.25%) |
844.80 |
816.75 - 880.00 |
1.3675 times |
Fri 19 September 2025 |
845.25 (-0.37%) |
849.00 |
831.00 - 900.00 |
1.1258 times |
Fri 12 September 2025 |
848.35 (1.07%) |
846.10 |
838.00 - 889.00 |
0.7881 times |
Fri 05 September 2025 |
839.35 (-0.6%) |
847.30 |
825.10 - 879.00 |
1.0074 times |
Fri 29 August 2025 |
844.45 (-5.13%) |
889.35 |
830.00 - 889.35 |
1.634 times |
Fri 22 August 2025 |
890.15 (9.99%) |
823.00 |
813.80 - 900.50 |
1.6716 times |
Thu 14 August 2025 |
809.30 (-1.59%) |
815.00 |
780.05 - 815.25 |
0.7302 times |
Monthly price and charts RaneMadras Strong monthly Stock price targets for RaneMadras 532661 are 815.63 and 864.33 | Monthly Target 1 | 780.62 | | Monthly Target 2 | 801.93 | | Monthly Target 3 | 829.31666666667 | | Monthly Target 4 | 850.63 | | Monthly Target 5 | 878.02 |
Monthly price and volumes Rane Madras
| Date |
Closing |
Open |
Range |
Volume |
Tue 21 October 2025 |
823.25 (1.26%) |
819.80 |
808.00 - 856.70 |
0.3882 times |
Tue 30 September 2025 |
813.00 (-3.72%) |
847.30 |
811.00 - 900.00 |
0.7359 times |
Fri 29 August 2025 |
844.45 (0.2%) |
843.10 |
780.05 - 900.50 |
0.9879 times |
Thu 31 July 2025 |
842.75 (-8.12%) |
932.25 |
816.20 - 932.25 |
1.743 times |
Mon 30 June 2025 |
917.20 (1.29%) |
905.00 |
858.45 - 1054.55 |
2.68 times |
Fri 30 May 2025 |
905.50 (22.85%) |
736.05 |
693.00 - 937.55 |
0.8986 times |
Wed 30 April 2025 |
737.10 (17.08%) |
638.50 |
620.15 - 797.25 |
0.9857 times |
Fri 28 March 2025 |
629.55 (3.25%) |
608.25 |
577.95 - 695.60 |
0.6861 times |
Fri 28 February 2025 |
609.75 (-14.59%) |
786.00 |
603.50 - 786.00 |
0.4002 times |
Fri 31 January 2025 |
713.95 (-17.27%) |
864.95 |
673.10 - 925.00 |
0.4943 times |
Tue 31 December 2024 |
862.95 (-0.78%) |
865.55 |
850.00 - 1022.00 |
0.3302 times |
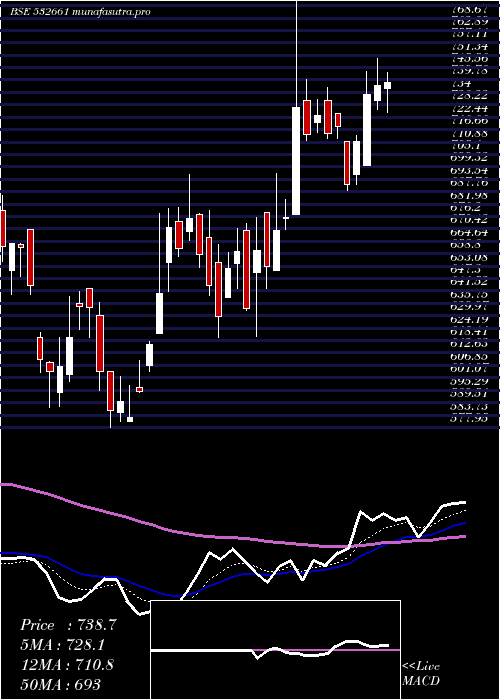
DMA SMA EMA moving averages of Rane Madras 532661
DMA (daily moving average) of Rane Madras 532661
| DMA period | DMA value | | 5 day DMA | 820.55 | | 12 day DMA | 828.02 | | 20 day DMA | 830.08 | | 35 day DMA | 839.05 | | 50 day DMA | 841.19 | | 100 day DMA | 866.11 | | 150 day DMA | 814.73 | | 200 day DMA | 797 | EMA (exponential moving average) of Rane Madras 532661
| EMA period | EMA current | EMA prev | EMA prev2 | | 5 day EMA | 821.72 | 820.95 | 821.07 | | 12 day EMA | 825.75 | 826.2 | 827.2 | | 20 day EMA | 829.58 | 830.25 | 831.26 | | 35 day EMA | 833.82 | 834.44 | 835.25 | | 50 day EMA | 838.38 | 839 | 839.75 |
SMA (simple moving average) of Rane Madras 532661
| SMA period | SMA current | SMA prev | SMA prev2 | | 5 day SMA | 820.55 | 820.5 | 822.39 | | 12 day SMA | 828.02 | 829.32 | 829.17 | | 20 day SMA | 830.08 | 830.9 | 832.12 | | 35 day SMA | 839.05 | 839.27 | 839.95 | | 50 day SMA | 841.19 | 841.05 | 841.24 | | 100 day SMA | 866.11 | 866.78 | 867.08 | | 150 day SMA | 814.73 | 813.37 | 811.94 | | 200 day SMA | 797 | 797.23 | 797.57 |
|
|
