PondyOxides 532626 full analysis,charts,indicators,moving averages,SMA,DMA,EMA,ADX,MACD,RSIPondy Oxides 532626 WideScreen charts, DMA,SMA,EMA technical analysis, forecast prediction, by indicators ADX,MACD,RSI,CCI BSE stock exchange
Daily price and charts and targets PondyOxides Strong Daily Stock price targets for PondyOxides 532626 are 1305.65 and 1423.2 | Daily Target 1 | 1282.07 | | Daily Target 2 | 1329.23 | | Daily Target 3 | 1399.6166666667 | | Daily Target 4 | 1446.78 | | Daily Target 5 | 1517.17 |
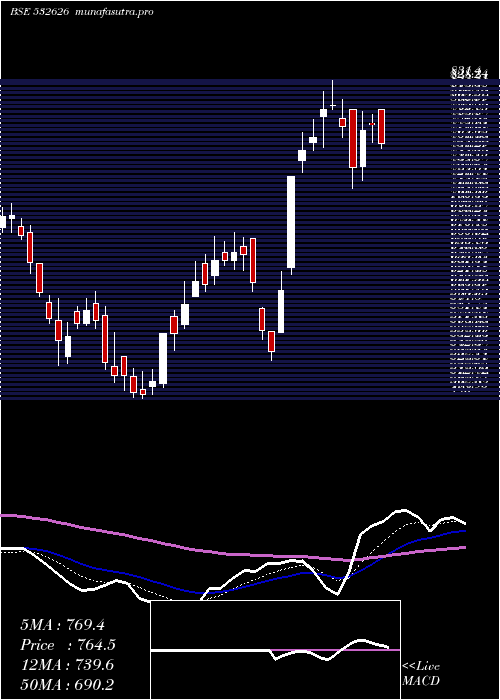
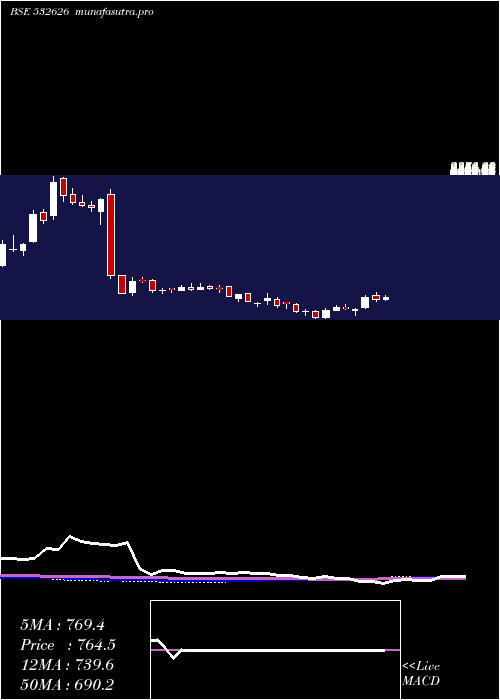
Daily price and volume Pondy Oxides
| Date |
Closing |
Open |
Range |
Volume |
Thu 23 October 2025 |
1376.40 (-5.08%) |
1467.80 |
1352.45 - 1470.00 |
0.7325 times |
Tue 21 October 2025 |
1450.00 (0.47%) |
1478.95 |
1431.05 - 1478.95 |
0.1775 times |
Mon 20 October 2025 |
1443.15 (5.16%) |
1399.95 |
1382.55 - 1479.20 |
1.1096 times |
Fri 17 October 2025 |
1372.40 (0.38%) |
1378.15 |
1293.00 - 1507.05 |
5.153 times |
Thu 16 October 2025 |
1367.15 (-0.19%) |
1369.00 |
1346.05 - 1386.50 |
0.3176 times |
Wed 15 October 2025 |
1369.75 (5.12%) |
1315.00 |
1297.85 - 1374.00 |
0.5605 times |
Tue 14 October 2025 |
1303.00 (-2.27%) |
1334.05 |
1268.05 - 1374.80 |
0.5063 times |
Mon 13 October 2025 |
1333.25 (2.17%) |
1304.95 |
1287.85 - 1342.30 |
0.3278 times |
Fri 10 October 2025 |
1304.95 (-0.97%) |
1317.95 |
1278.95 - 1324.95 |
0.5939 times |
Thu 09 October 2025 |
1317.75 (2.74%) |
1293.40 |
1264.90 - 1326.80 |
0.5213 times |
Wed 08 October 2025 |
1282.60 (2.99%) |
1268.90 |
1258.20 - 1354.95 |
2.0524 times |
Weekly price and charts PondyOxides Strong weekly Stock price targets for PondyOxides 532626 are 1301.05 and 1427.8 | Weekly Target 1 | 1275.93 | | Weekly Target 2 | 1326.17 | | Weekly Target 3 | 1402.6833333333 | | Weekly Target 4 | 1452.92 | | Weekly Target 5 | 1529.43 |
Weekly price and volumes for Pondy Oxides
| Date |
Closing |
Open |
Range |
Volume |
Thu 23 October 2025 |
1376.40 (0.29%) |
1399.95 |
1352.45 - 1479.20 |
0.6374 times |
Fri 17 October 2025 |
1372.40 (5.17%) |
1304.95 |
1268.05 - 1507.05 |
2.1666 times |
Fri 10 October 2025 |
1304.95 (4.63%) |
1260.00 |
1217.00 - 1354.95 |
1.1976 times |
Fri 03 October 2025 |
1247.20 (6.92%) |
1166.55 |
1125.00 - 1256.65 |
0.4615 times |
Fri 26 September 2025 |
1166.45 (-12.02%) |
1334.75 |
1163.90 - 1360.00 |
0.8328 times |
Fri 19 September 2025 |
1325.85 (5.01%) |
1263.45 |
1224.10 - 1353.95 |
0.9777 times |
Fri 12 September 2025 |
1262.55 (0.4%) |
1298.95 |
1215.00 - 1335.00 |
1.3316 times |
Fri 05 September 2025 |
1257.55 (19.69%) |
1056.00 |
1052.00 - 1269.85 |
1.0573 times |
Fri 29 August 2025 |
1050.70 (-4.01%) |
1109.00 |
1044.00 - 1166.00 |
0.6226 times |
Fri 22 August 2025 |
1094.60 (4.61%) |
1072.25 |
1028.55 - 1150.20 |
0.715 times |
Thu 14 August 2025 |
1046.40 (-2.28%) |
1070.80 |
1013.05 - 1160.00 |
0.6338 times |
Monthly price and charts PondyOxides Strong monthly Stock price targets for PondyOxides 532626 are 1250.7 and 1632.75 | Monthly Target 1 | 954.1 | | Monthly Target 2 | 1165.25 | | Monthly Target 3 | 1336.15 | | Monthly Target 4 | 1547.3 | | Monthly Target 5 | 1718.2 |
Monthly price and volumes Pondy Oxides
| Date |
Closing |
Open |
Range |
Volume |
Thu 23 October 2025 |
1376.40 (20.16%) |
1125.00 |
1125.00 - 1507.05 |
1.6833 times |
Tue 30 September 2025 |
1145.50 (9.02%) |
1056.00 |
1052.00 - 1360.00 |
1.7723 times |
Fri 29 August 2025 |
1050.70 (-11.46%) |
1187.00 |
1013.05 - 1198.90 |
0.9024 times |
Thu 31 July 2025 |
1186.70 (36.22%) |
868.25 |
842.50 - 1210.80 |
1.6168 times |
Mon 30 June 2025 |
871.15 (16.4%) |
748.05 |
689.10 - 879.35 |
0.5652 times |
Fri 30 May 2025 |
748.40 (-2.1%) |
763.05 |
677.05 - 902.25 |
1.124 times |
Wed 30 April 2025 |
764.45 (19.39%) |
640.00 |
533.40 - 831.40 |
0.8354 times |
Fri 28 March 2025 |
640.30 (10.86%) |
576.00 |
493.00 - 665.50 |
0.7375 times |
Fri 28 February 2025 |
577.60 (-16.31%) |
724.50 |
573.00 - 814.95 |
0.3339 times |
Fri 31 January 2025 |
690.15 (-18.27%) |
861.30 |
644.40 - 928.85 |
0.4292 times |
Tue 31 December 2024 |
844.40 (-3.65%) |
860.05 |
831.15 - 955.00 |
0.3603 times |

DMA SMA EMA moving averages of Pondy Oxides 532626
DMA (daily moving average) of Pondy Oxides 532626
| DMA period | DMA value | | 5 day DMA | 1401.82 | | 12 day DMA | 1347.15 | | 20 day DMA | 1286.34 | | 35 day DMA | 1274.44 | | 50 day DMA | 1217.68 | | 100 day DMA | 1064.7 | | 150 day DMA | 942.65 | | 200 day DMA | 890.26 | EMA (exponential moving average) of Pondy Oxides 532626
| EMA period | EMA current | EMA prev | EMA prev2 | | 5 day EMA | 1394.62 | 1403.73 | 1380.6 | | 12 day EMA | 1353.36 | 1349.17 | 1330.84 | | 20 day EMA | 1319.12 | 1313.09 | 1298.68 | | 35 day EMA | 1265.59 | 1259.07 | 1247.83 | | 50 day EMA | 1227.08 | 1220.99 | 1211.65 |
SMA (simple moving average) of Pondy Oxides 532626
| SMA period | SMA current | SMA prev | SMA prev2 | | 5 day SMA | 1401.82 | 1400.49 | 1371.09 | | 12 day SMA | 1347.15 | 1335.7 | 1318.8 | | 20 day SMA | 1286.34 | 1281.98 | 1275.11 | | 35 day SMA | 1274.44 | 1266.02 | 1255.19 | | 50 day SMA | 1217.68 | 1211.57 | 1204.61 | | 100 day SMA | 1064.7 | 1058.55 | 1051.61 | | 150 day SMA | 942.65 | 937.38 | 931.53 | | 200 day SMA | 890.26 | 887.91 | 885.17 |
|
|
