Jindalph 532624 full analysis,charts,indicators,moving averages,SMA,DMA,EMA,ADX,MACD,RSIJindalph 532624 WideScreen charts, DMA,SMA,EMA technical analysis, forecast prediction, by indicators ADX,MACD,RSI,CCI BSE stock exchange
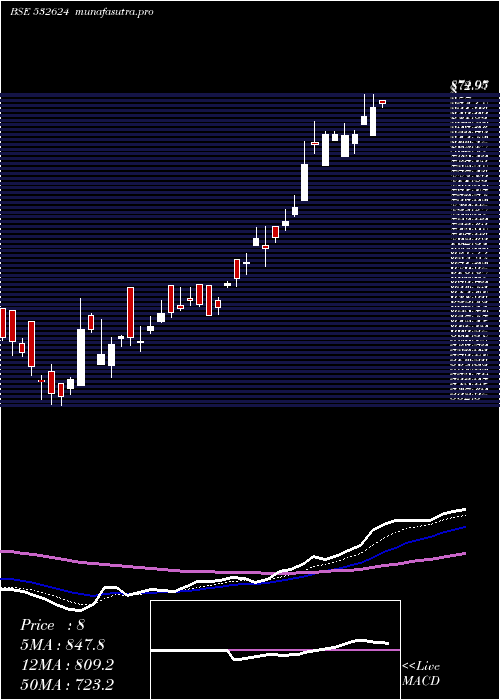
Daily price and charts and targets Jindalph Strong Daily Stock price targets for Jindalph 532624 are 1443.85 and 1460 | Daily Target 1 | 1431.55 | | Daily Target 2 | 1440 | | Daily Target 3 | 1447.7 | | Daily Target 4 | 1456.15 | | Daily Target 5 | 1463.85 |
Daily price and volume Jindalph
| Date |
Closing |
Open |
Range |
Volume |
Tue 21 October 2025 |
1448.45 (1.38%) |
1443.50 |
1439.25 - 1455.40 |
0.0136 times |
Mon 20 October 2025 |
1428.75 (3.88%) |
1383.05 |
1383.05 - 1538.90 |
0.5872 times |
Fri 17 October 2025 |
1375.35 (-2.94%) |
1400.75 |
1373.50 - 1411.60 |
0.1289 times |
Thu 16 October 2025 |
1417.05 (-0.92%) |
1430.00 |
1385.40 - 1455.40 |
0.1315 times |
Wed 15 October 2025 |
1430.15 (-3.75%) |
1490.20 |
1416.25 - 1515.55 |
0.1863 times |
Tue 14 October 2025 |
1485.80 (1.09%) |
1499.25 |
1469.85 - 1541.35 |
0.294 times |
Mon 13 October 2025 |
1469.85 (-5.25%) |
1497.95 |
1455.00 - 1512.00 |
0.1852 times |
Fri 10 October 2025 |
1551.35 (11.77%) |
1479.95 |
1400.00 - 1586.15 |
5.9123 times |
Thu 09 October 2025 |
1388.00 (20%) |
1171.00 |
1171.00 - 1388.00 |
2.1362 times |
Wed 08 October 2025 |
1156.70 (0.91%) |
1147.00 |
1130.00 - 1193.40 |
0.4248 times |
Tue 07 October 2025 |
1146.30 (1.61%) |
1123.00 |
1123.00 - 1150.00 |
0.392 times |
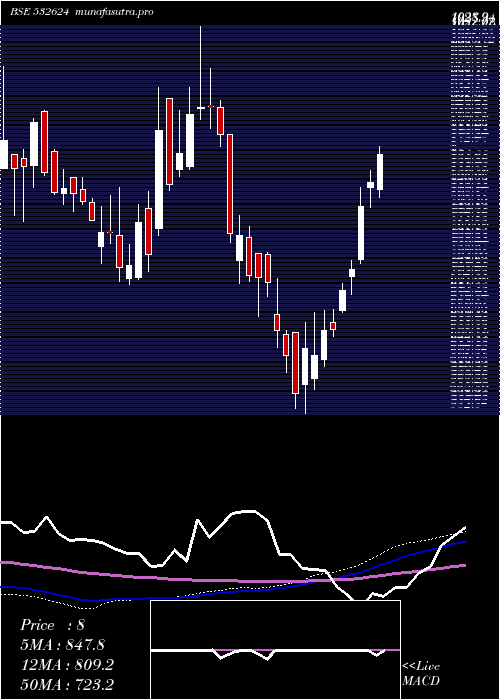
Weekly price and charts Jindalph Strong weekly Stock price targets for Jindalph 532624 are 1415.75 and 1571.6 | Weekly Target 1 | 1300.95 | | Weekly Target 2 | 1374.7 | | Weekly Target 3 | 1456.8 | | Weekly Target 4 | 1530.55 | | Weekly Target 5 | 1612.65 |
Weekly price and volumes for Jindalph
| Date |
Closing |
Open |
Range |
Volume |
Tue 21 October 2025 |
1448.45 (5.32%) |
1383.05 |
1383.05 - 1538.90 |
0.2668 times |
Fri 17 October 2025 |
1375.35 (-11.34%) |
1497.95 |
1373.50 - 1541.35 |
0.4112 times |
Fri 10 October 2025 |
1551.35 (41.03%) |
1127.90 |
1123.00 - 1586.15 |
3.9511 times |
Fri 03 October 2025 |
1100.00 (0%) |
1112.15 |
1081.30 - 1121.40 |
0.0594 times |
Fri 26 September 2025 |
1100.00 (-3.03%) |
1121.00 |
1075.55 - 1180.00 |
0.2351 times |
Fri 19 September 2025 |
1134.40 (4.36%) |
1090.00 |
1081.35 - 1187.00 |
0.6521 times |
Fri 12 September 2025 |
1087.05 (-7.82%) |
1180.00 |
1080.00 - 1188.05 |
0.2101 times |
Fri 05 September 2025 |
1179.30 (14.99%) |
1122.05 |
1107.65 - 1290.00 |
3.4417 times |
Fri 29 August 2025 |
1025.60 (22.83%) |
882.00 |
840.00 - 1025.60 |
0.7565 times |
Thu 21 August 2025 |
835.00 (1.21%) |
830.10 |
816.00 - 869.00 |
0.016 times |
Wed 13 August 2025 |
825.00 (-0.6%) |
791.10 |
791.10 - 858.00 |
0.1867 times |
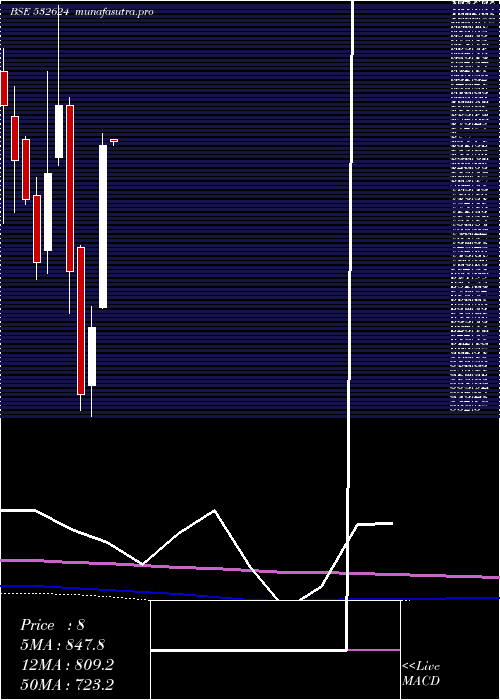
Monthly price and charts Jindalph Strong monthly Stock price targets for Jindalph 532624 are 1273.33 and 1761.28 | Monthly Target 1 | 889.65 | | Monthly Target 2 | 1169.05 | | Monthly Target 3 | 1377.6 | | Monthly Target 4 | 1657 | | Monthly Target 5 | 1865.55 |
Monthly price and volumes Jindalph
| Date |
Closing |
Open |
Range |
Volume |
Tue 21 October 2025 |
1448.45 (31.08%) |
1100.00 |
1098.20 - 1586.15 |
1.714 times |
Tue 30 September 2025 |
1105.00 (7.74%) |
1122.05 |
1075.55 - 1290.00 |
1.6725 times |
Fri 29 August 2025 |
1025.60 (15.5%) |
888.00 |
791.10 - 1025.60 |
0.376 times |
Wed 30 July 2025 |
888.00 (-7.45%) |
955.00 |
840.00 - 955.00 |
0.1712 times |
Mon 30 June 2025 |
959.50 (12.13%) |
816.40 |
815.00 - 1012.45 |
0.5187 times |
Fri 30 May 2025 |
855.70 (-0.5%) |
867.45 |
836.00 - 1012.00 |
1.7644 times |
Wed 30 April 2025 |
860.00 (34.25%) |
665.00 |
662.80 - 874.95 |
0.708 times |
Fri 28 March 2025 |
640.60 (14.61%) |
570.15 |
532.30 - 666.00 |
1.0067 times |
Fri 28 February 2025 |
558.95 (-20.99%) |
736.65 |
539.70 - 738.70 |
0.6022 times |
Fri 31 January 2025 |
707.40 (-22.14%) |
908.00 |
657.00 - 918.60 |
1.4662 times |
Tue 31 December 2024 |
908.55 (9.9%) |
845.10 |
836.20 - 1028.90 |
4.6962 times |
DMA SMA EMA moving averages of Jindalph 532624
DMA (daily moving average) of Jindalph 532624
| DMA period | DMA value | | 5 day DMA | 1419.95 | | 12 day DMA | 1368.82 | | 20 day DMA | 1263.63 | | 35 day DMA | 1209.73 | | 50 day DMA | 1110.05 | | 100 day DMA | 1001.93 | | 150 day DMA | 918.99 | | 200 day DMA | 877.13 | EMA (exponential moving average) of Jindalph 532624
| EMA period | EMA current | EMA prev | EMA prev2 | | 5 day EMA | 1424.26 | 1412.16 | 1403.86 | | 12 day EMA | 1367.09 | 1352.3 | 1338.4 | | 20 day EMA | 1303.93 | 1288.72 | 1273.99 | | 35 day EMA | 1206.78 | 1192.55 | 1178.64 | | 50 day EMA | 1121.07 | 1107.71 | 1094.61 |
SMA (simple moving average) of Jindalph 532624
| SMA period | SMA current | SMA prev | SMA prev2 | | 5 day SMA | 1419.95 | 1427.42 | 1435.64 | | 12 day SMA | 1368.82 | 1339.78 | 1312.39 | | 20 day SMA | 1263.63 | 1247.26 | 1232.54 | | 35 day SMA | 1209.73 | 1203.51 | 1191.99 | | 50 day SMA | 1110.05 | 1098.04 | 1087.32 | | 100 day SMA | 1001.93 | 996.46 | 991.29 | | 150 day SMA | 918.99 | 913.17 | 907.58 | | 200 day SMA | 877.13 | 874.77 | 872.58 |
|
|
