IndocoRem 532612 full analysis,charts,indicators,moving averages,SMA,DMA,EMA,ADX,MACD,RSIIndoco Rem 532612 WideScreen charts, DMA,SMA,EMA technical analysis, forecast prediction, by indicators ADX,MACD,RSI,CCI BSE stock exchange
Daily price and charts and targets IndocoRem Strong Daily Stock price targets for IndocoRem 532612 are 278.45 and 285.65 | Daily Target 1 | 277.1 | | Daily Target 2 | 279.8 | | Daily Target 3 | 284.3 | | Daily Target 4 | 287 | | Daily Target 5 | 291.5 |
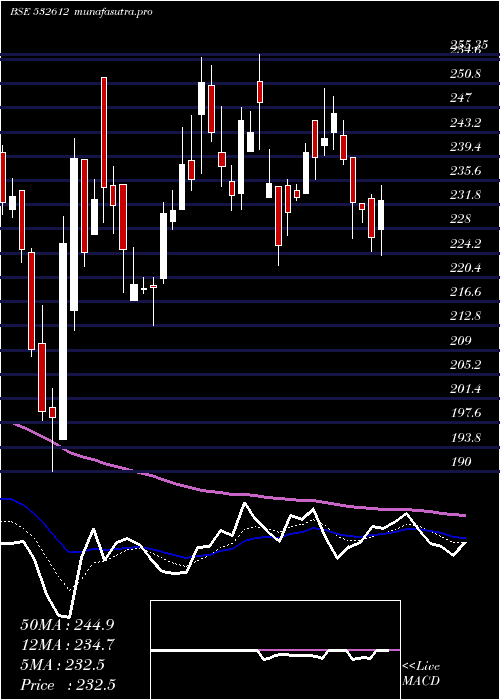
Daily price and volume Indoco Rem
| Date |
Closing |
Open |
Range |
Volume |
Thu 23 October 2025 |
282.50 (-1.89%) |
288.75 |
281.60 - 288.80 |
0.8182 times |
Tue 21 October 2025 |
287.95 (0.28%) |
287.00 |
285.65 - 289.00 |
0.2794 times |
Mon 20 October 2025 |
287.15 (0.54%) |
287.05 |
283.65 - 289.00 |
0.0182 times |
Fri 17 October 2025 |
285.60 (-2.29%) |
291.05 |
283.55 - 291.40 |
0.2345 times |
Thu 16 October 2025 |
292.30 (1.92%) |
292.55 |
288.65 - 300.00 |
0.4323 times |
Wed 15 October 2025 |
286.80 (-2.58%) |
294.30 |
285.30 - 294.95 |
0.4691 times |
Tue 14 October 2025 |
294.40 (-0.49%) |
304.70 |
293.10 - 304.70 |
0.4829 times |
Mon 13 October 2025 |
295.85 (2.98%) |
287.80 |
287.00 - 317.10 |
7.0032 times |
Fri 10 October 2025 |
287.30 (-1.15%) |
291.05 |
286.05 - 291.85 |
0.0412 times |
Thu 09 October 2025 |
290.65 (-1.07%) |
293.55 |
289.75 - 294.90 |
0.2211 times |
Wed 08 October 2025 |
293.80 (0.62%) |
290.40 |
290.00 - 297.20 |
0.3618 times |
Weekly price and charts IndocoRem Strong weekly Stock price targets for IndocoRem 532612 are 278.35 and 285.75 | Weekly Target 1 | 276.97 | | Weekly Target 2 | 279.73 | | Weekly Target 3 | 284.36666666667 | | Weekly Target 4 | 287.13 | | Weekly Target 5 | 291.77 |
Weekly price and volumes for Indoco Rem
| Date |
Closing |
Open |
Range |
Volume |
Thu 23 October 2025 |
282.50 (-1.09%) |
287.05 |
281.60 - 289.00 |
0.0672 times |
Fri 17 October 2025 |
285.60 (-0.59%) |
287.80 |
283.55 - 317.10 |
0.5195 times |
Fri 10 October 2025 |
287.30 (-1.19%) |
293.65 |
283.15 - 297.20 |
0.0737 times |
Fri 03 October 2025 |
290.75 (1.86%) |
292.05 |
286.00 - 315.90 |
0.0844 times |
Fri 26 September 2025 |
285.45 (-5.15%) |
301.30 |
285.00 - 308.30 |
0.1469 times |
Fri 19 September 2025 |
300.95 (0.72%) |
307.30 |
292.25 - 327.65 |
0.7256 times |
Fri 12 September 2025 |
298.80 (9.57%) |
272.65 |
272.65 - 332.15 |
7.996 times |
Fri 05 September 2025 |
272.70 (2.38%) |
266.00 |
265.00 - 285.70 |
0.0453 times |
Fri 29 August 2025 |
266.35 (-4.47%) |
278.00 |
265.90 - 283.80 |
0.0394 times |
Fri 22 August 2025 |
278.80 (-2.16%) |
285.00 |
271.15 - 299.25 |
0.3021 times |
Thu 14 August 2025 |
284.95 (-2.28%) |
288.60 |
283.60 - 309.50 |
0.1005 times |

Monthly price and charts IndocoRem Strong monthly Stock price targets for IndocoRem 532612 are 264.3 and 299.8 | Monthly Target 1 | 258.23 | | Monthly Target 2 | 270.37 | | Monthly Target 3 | 293.73333333333 | | Monthly Target 4 | 305.87 | | Monthly Target 5 | 329.23 |
Monthly price and volumes Indoco Rem
| Date |
Closing |
Open |
Range |
Volume |
Thu 23 October 2025 |
282.50 (-3.45%) |
291.70 |
281.60 - 317.10 |
0.4198 times |
Tue 30 September 2025 |
292.60 (9.86%) |
266.00 |
265.00 - 332.15 |
5.2246 times |
Fri 29 August 2025 |
266.35 (-15.95%) |
316.70 |
265.90 - 319.20 |
0.3539 times |
Thu 31 July 2025 |
316.90 (0.3%) |
320.25 |
292.50 - 348.10 |
0.7256 times |
Mon 30 June 2025 |
315.95 (26.23%) |
255.00 |
249.05 - 323.75 |
0.4341 times |
Fri 30 May 2025 |
250.30 (7.66%) |
240.95 |
223.00 - 275.80 |
0.5177 times |
Wed 30 April 2025 |
232.50 (-0.34%) |
233.50 |
222.25 - 255.35 |
0.2351 times |
Fri 28 March 2025 |
233.30 (17.59%) |
195.00 |
195.00 - 254.90 |
0.9601 times |
Fri 28 February 2025 |
198.40 (-20.29%) |
259.95 |
190.00 - 283.95 |
0.4068 times |
Fri 31 January 2025 |
248.90 (-25.65%) |
332.30 |
242.00 - 348.00 |
0.7224 times |
Tue 31 December 2024 |
334.75 (3.05%) |
329.95 |
310.25 - 353.80 |
1.1389 times |

DMA SMA EMA moving averages of Indoco Rem 532612
DMA (daily moving average) of Indoco Rem 532612
| DMA period | DMA value | | 5 day DMA | 287.1 | | 12 day DMA | 289.69 | | 20 day DMA | 290.76 | | 35 day DMA | 290.95 | | 50 day DMA | 288.2 | | 100 day DMA | 295.94 | | 150 day DMA | 277.24 | | 200 day DMA | 278.01 | EMA (exponential moving average) of Indoco Rem 532612
| EMA period | EMA current | EMA prev | EMA prev2 | | 5 day EMA | 286.44 | 288.41 | 288.64 | | 12 day EMA | 288.69 | 289.82 | 290.16 | | 20 day EMA | 289.76 | 290.52 | 290.79 | | 35 day EMA | 289.13 | 289.52 | 289.61 | | 50 day EMA | 288.51 | 288.76 | 288.79 |
SMA (simple moving average) of Indoco Rem 532612
| SMA period | SMA current | SMA prev | SMA prev2 | | 5 day SMA | 287.1 | 287.96 | 289.25 | | 12 day SMA | 289.69 | 289.8 | 290.03 | | 20 day SMA | 290.76 | 291.74 | 292.26 | | 35 day SMA | 290.95 | 290.79 | 290.19 | | 50 day SMA | 288.2 | 288.38 | 288.3 | | 100 day SMA | 295.94 | 295.66 | 295.23 | | 150 day SMA | 277.24 | 276.91 | 276.48 | | 200 day SMA | 278.01 | 278.25 | 278.46 |
|
|
