Tcs 532540 full analysis,charts,indicators,moving averages,SMA,DMA,EMA,ADX,MACD,RSITcs 532540 WideScreen charts, DMA,SMA,EMA technical analysis, forecast prediction, by indicators ADX,MACD,RSI,CCI BSE stock exchange
Daily price and charts and targets Tcs Strong Daily Stock price targets for Tcs 532540 are 3207.35 and 3254.8 | Daily Target 1 | 3196.83 | | Daily Target 2 | 3217.87 | | Daily Target 3 | 3244.2833333333 | | Daily Target 4 | 3265.32 | | Daily Target 5 | 3291.73 |
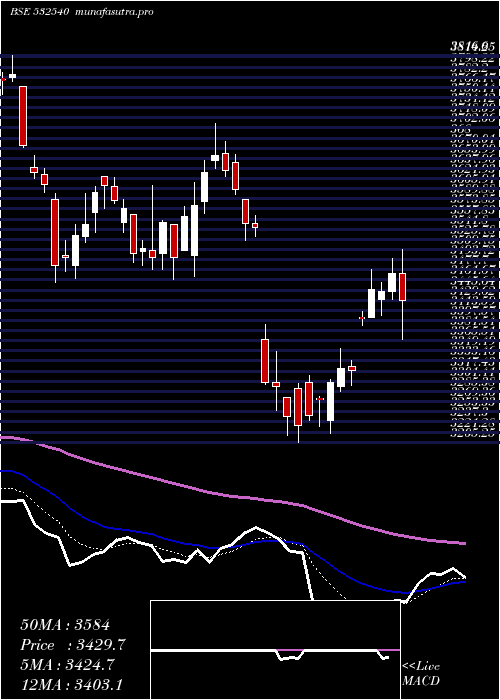
Daily price and volume Tcs
| Date |
Closing |
Open |
Range |
Volume |
Fri 05 December 2025 |
3238.90 (0.31%) |
3239.50 |
3223.25 - 3270.70 |
1.5752 times |
Thu 04 December 2025 |
3228.90 (1.54%) |
3181.25 |
3181.25 - 3249.95 |
2.3951 times |
Wed 03 December 2025 |
3179.95 (1.41%) |
3150.00 |
3136.00 - 3212.00 |
0.978 times |
Tue 02 December 2025 |
3135.60 (-0%) |
3125.20 |
3121.05 - 3143.70 |
0.3108 times |
Mon 01 December 2025 |
3135.70 (-0.13%) |
3135.00 |
3122.70 - 3152.50 |
0.9202 times |
Fri 28 November 2025 |
3139.65 (0.09%) |
3136.50 |
3125.00 - 3146.95 |
0.2877 times |
Thu 27 November 2025 |
3136.90 (-0.8%) |
3174.15 |
3125.00 - 3178.85 |
1.8081 times |
Wed 26 November 2025 |
3162.25 (1.36%) |
3119.80 |
3117.95 - 3177.00 |
0.7453 times |
Tue 25 November 2025 |
3119.80 (-0.66%) |
3140.75 |
3115.45 - 3146.95 |
0.4751 times |
Mon 24 November 2025 |
3140.55 (-0.3%) |
3145.45 |
3131.40 - 3179.00 |
0.5043 times |
Fri 21 November 2025 |
3150.05 (0.14%) |
3145.75 |
3136.00 - 3170.00 |
1.0906 times |
Weekly price and charts Tcs Strong weekly Stock price targets for Tcs 532540 are 3179.98 and 3329.63 | Weekly Target 1 | 3060.57 | | Weekly Target 2 | 3149.73 | | Weekly Target 3 | 3210.2166666667 | | Weekly Target 4 | 3299.38 | | Weekly Target 5 | 3359.87 |
Weekly price and volumes for Tcs
| Date |
Closing |
Open |
Range |
Volume |
Fri 05 December 2025 |
3238.90 (3.16%) |
3135.00 |
3121.05 - 3270.70 |
1.2437 times |
Fri 28 November 2025 |
3139.65 (-0.33%) |
3145.45 |
3115.45 - 3179.00 |
0.769 times |
Fri 21 November 2025 |
3150.05 (1.45%) |
3109.95 |
3080.00 - 3170.00 |
0.6789 times |
Fri 14 November 2025 |
3105.00 (3.76%) |
2990.00 |
2990.00 - 3136.00 |
1.0656 times |
Fri 07 November 2025 |
2992.35 (-2.14%) |
3055.75 |
2960.00 - 3055.75 |
0.8734 times |
Fri 31 October 2025 |
3057.80 (-0.55%) |
3063.20 |
3026.70 - 3093.75 |
0.5093 times |
Thu 23 October 2025 |
3074.65 (3.78%) |
2971.15 |
2971.15 - 3097.95 |
1.6533 times |
Fri 17 October 2025 |
2962.60 (-2.17%) |
3005.05 |
2944.25 - 3036.00 |
1.077 times |
Fri 10 October 2025 |
3028.40 (4.35%) |
2902.00 |
2895.95 - 3070.05 |
1.2381 times |
Fri 03 October 2025 |
2902.15 (0.07%) |
2911.15 |
2867.55 - 2928.80 |
0.8918 times |
Fri 26 September 2025 |
2900.10 (-8.51%) |
3070.10 |
2892.00 - 3106.60 |
1.6083 times |

Monthly price and charts Tcs Strong monthly Stock price targets for Tcs 532540 are 3179.98 and 3329.63 | Monthly Target 1 | 3060.57 | | Monthly Target 2 | 3149.73 | | Monthly Target 3 | 3210.2166666667 | | Monthly Target 4 | 3299.38 | | Monthly Target 5 | 3359.87 |
Monthly price and volumes Tcs
| Date |
Closing |
Open |
Range |
Volume |
Fri 05 December 2025 |
3238.90 (3.16%) |
3135.00 |
3121.05 - 3270.70 |
0.4287 times |
Fri 28 November 2025 |
3139.65 (2.68%) |
3055.75 |
2960.00 - 3179.00 |
1.1674 times |
Fri 31 October 2025 |
3057.80 (5.84%) |
2889.00 |
2867.55 - 3097.95 |
1.7453 times |
Tue 30 September 2025 |
2889.00 (-6.34%) |
3096.60 |
2886.00 - 3202.95 |
1.508 times |
Fri 29 August 2025 |
3084.40 (1.55%) |
3021.45 |
2992.05 - 3163.40 |
0.8825 times |
Thu 31 July 2025 |
3037.35 (-12.24%) |
3460.95 |
3015.05 - 3489.85 |
1.1488 times |
Mon 30 June 2025 |
3461.05 (-0.1%) |
3462.70 |
3358.00 - 3539.45 |
1.3253 times |
Fri 30 May 2025 |
3464.50 (1.02%) |
3474.50 |
3380.00 - 3630.00 |
0.8082 times |
Wed 30 April 2025 |
3429.65 (-4.85%) |
3588.95 |
3205.25 - 3588.95 |
0.5876 times |
Fri 28 March 2025 |
3604.45 (3.46%) |
3499.85 |
3463.05 - 3708.90 |
0.3982 times |
Fri 28 February 2025 |
3483.90 (-15.21%) |
4030.00 |
3457.35 - 4161.00 |
0.5265 times |

DMA SMA EMA moving averages of Tcs 532540
DMA (daily moving average) of Tcs 532540
| DMA period | DMA value | | 5 day DMA | 3183.81 | | 12 day DMA | 3159.5 | | 20 day DMA | 3125.52 | | 35 day DMA | 3079.38 | | 50 day DMA | 3049.99 | | 100 day DMA | 3080.87 | | 150 day DMA | 3207.43 | | 200 day DMA | 3309.24 | EMA (exponential moving average) of Tcs 532540
| EMA period | EMA current | EMA prev | EMA prev2 | | 5 day EMA | 3197.68 | 3177.07 | 3151.16 | | 12 day EMA | 3161.33 | 3147.23 | 3132.39 | | 20 day EMA | 3134.71 | 3123.75 | 3112.69 | | 35 day EMA | 3103.25 | 3095.26 | 3087.39 | | 50 day EMA | 3072.33 | 3065.53 | 3058.86 |
SMA (simple moving average) of Tcs 532540
| SMA period | SMA current | SMA prev | SMA prev2 | | 5 day SMA | 3183.81 | 3163.96 | 3145.56 | | 12 day SMA | 3159.5 | 3146.73 | 3136.2 | | 20 day SMA | 3125.52 | 3114.13 | 3102.18 | | 35 day SMA | 3079.38 | 3072.76 | 3067.03 | | 50 day SMA | 3049.99 | 3048.61 | 3047.55 | | 100 day SMA | 3080.87 | 3082.32 | 3084.1 | | 150 day SMA | 3207.43 | 3208.8 | 3210.25 | | 200 day SMA | 3309.24 | 3313.38 | 3317.78 |
|
|
