BankMaha 532525 full analysis,charts,indicators,moving averages,SMA,DMA,EMA,ADX,MACD,RSIBank Maha 532525 WideScreen charts, DMA,SMA,EMA technical analysis, forecast prediction, by indicators ADX,MACD,RSI,CCI BSE stock exchange
Daily price and charts and targets BankMaha Strong Daily Stock price targets for BankMaha 532525 are 59.57 and 60.3 | Daily Target 1 | 59.41 | | Daily Target 2 | 59.73 | | Daily Target 3 | 60.14 | | Daily Target 4 | 60.46 | | Daily Target 5 | 60.87 |
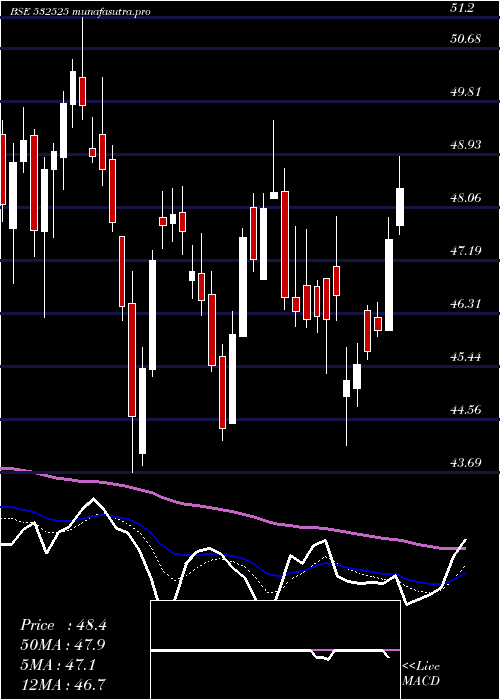
Daily price and volume Bank Maha
| Date |
Closing |
Open |
Range |
Volume |
Tue 21 October 2025 |
60.05 (0.79%) |
60.28 |
59.82 - 60.55 |
0.3057 times |
Mon 20 October 2025 |
59.58 (4.36%) |
57.85 |
57.40 - 59.92 |
0.9683 times |
Fri 17 October 2025 |
57.09 (-0.92%) |
57.67 |
56.54 - 57.87 |
0.4252 times |
Thu 16 October 2025 |
57.62 (-2.83%) |
59.77 |
57.42 - 61.39 |
2.1299 times |
Wed 15 October 2025 |
59.30 (7.47%) |
55.90 |
55.38 - 60.26 |
3.5304 times |
Tue 14 October 2025 |
55.18 (-4.15%) |
57.81 |
54.70 - 57.95 |
0.5416 times |
Mon 13 October 2025 |
57.57 (0.05%) |
57.76 |
57.04 - 57.96 |
0.6306 times |
Fri 10 October 2025 |
57.54 (1.62%) |
56.55 |
56.55 - 58.12 |
0.7706 times |
Thu 09 October 2025 |
56.62 (-0.11%) |
56.68 |
56.45 - 57.10 |
0.2727 times |
Wed 08 October 2025 |
56.68 (-0.91%) |
57.21 |
56.10 - 57.32 |
0.425 times |
Tue 07 October 2025 |
57.20 (0.07%) |
57.63 |
56.95 - 57.63 |
0.159 times |
Weekly price and charts BankMaha Strong weekly Stock price targets for BankMaha 532525 are 58.73 and 61.88 | Weekly Target 1 | 56.18 | | Weekly Target 2 | 58.12 | | Weekly Target 3 | 59.333333333333 | | Weekly Target 4 | 61.27 | | Weekly Target 5 | 62.48 |
Weekly price and volumes for Bank Maha
| Date |
Closing |
Open |
Range |
Volume |
Tue 21 October 2025 |
60.05 (5.18%) |
57.85 |
57.40 - 60.55 |
0.5805 times |
Fri 17 October 2025 |
57.09 (-0.78%) |
57.76 |
54.70 - 61.39 |
3.3069 times |
Fri 10 October 2025 |
57.54 (1.88%) |
56.62 |
56.10 - 58.12 |
0.8691 times |
Fri 03 October 2025 |
56.48 (4.57%) |
54.20 |
53.92 - 57.10 |
0.8142 times |
Fri 26 September 2025 |
54.01 (-5.76%) |
57.31 |
53.81 - 58.65 |
0.7562 times |
Fri 19 September 2025 |
57.31 (6.07%) |
54.00 |
54.00 - 57.93 |
1.3108 times |
Fri 12 September 2025 |
54.03 (2.62%) |
52.68 |
52.24 - 55.29 |
0.728 times |
Fri 05 September 2025 |
52.65 (1.21%) |
51.83 |
51.71 - 53.30 |
0.5757 times |
Fri 29 August 2025 |
52.02 (-5.02%) |
54.74 |
51.76 - 54.99 |
0.4774 times |
Fri 22 August 2025 |
54.77 (0.62%) |
54.60 |
54.60 - 55.90 |
0.5812 times |
Thu 14 August 2025 |
54.43 (-2.24%) |
55.90 |
54.30 - 56.19 |
0.4097 times |

Monthly price and charts BankMaha Strong monthly Stock price targets for BankMaha 532525 are 57.38 and 64.07 | Monthly Target 1 | 52.02 | | Monthly Target 2 | 56.04 | | Monthly Target 3 | 58.713333333333 | | Monthly Target 4 | 62.73 | | Monthly Target 5 | 65.4 |
Monthly price and volumes Bank Maha
| Date |
Closing |
Open |
Range |
Volume |
Tue 21 October 2025 |
60.05 (7.33%) |
56.19 |
54.70 - 61.39 |
0.9889 times |
Tue 30 September 2025 |
55.95 (7.55%) |
51.83 |
51.71 - 58.65 |
0.7436 times |
Fri 29 August 2025 |
52.02 (-7.26%) |
56.01 |
51.76 - 56.28 |
0.5062 times |
Thu 31 July 2025 |
56.09 (-1.77%) |
57.35 |
55.19 - 58.84 |
1.083 times |
Mon 30 June 2025 |
57.10 (5.76%) |
54.50 |
52.66 - 58.00 |
2.1902 times |
Fri 30 May 2025 |
53.99 (6.51%) |
50.61 |
47.14 - 54.40 |
1.221 times |
Wed 30 April 2025 |
50.69 (9.67%) |
46.76 |
44.13 - 52.40 |
0.7523 times |
Fri 28 March 2025 |
46.22 (-0.43%) |
46.48 |
43.69 - 49.50 |
0.7156 times |
Fri 28 February 2025 |
46.42 (-9.57%) |
50.47 |
46.20 - 51.75 |
0.4412 times |
Fri 31 January 2025 |
51.33 (-1.67%) |
52.08 |
46.25 - 56.26 |
1.3579 times |
Tue 31 December 2024 |
52.20 (-8.49%) |
56.45 |
50.83 - 59.85 |
1.0439 times |

DMA SMA EMA moving averages of Bank Maha 532525
DMA (daily moving average) of Bank Maha 532525
| DMA period | DMA value | | 5 day DMA | 58.73 | | 12 day DMA | 57.63 | | 20 day DMA | 56.89 | | 35 day DMA | 55.85 | | 50 day DMA | 55.42 | | 100 day DMA | 55.61 | | 150 day DMA | 53.35 | | 200 day DMA | 52.53 | EMA (exponential moving average) of Bank Maha 532525
| EMA period | EMA current | EMA prev | EMA prev2 | | 5 day EMA | 58.75 | 58.1 | 57.36 | | 12 day EMA | 57.81 | 57.4 | 57 | | 20 day EMA | 57.17 | 56.87 | 56.58 | | 35 day EMA | 56.35 | 56.13 | 55.93 | | 50 day EMA | 55.68 | 55.5 | 55.33 |
SMA (simple moving average) of Bank Maha 532525
| SMA period | SMA current | SMA prev | SMA prev2 | | 5 day SMA | 58.73 | 57.75 | 57.35 | | 12 day SMA | 57.63 | 57.34 | 57.03 | | 20 day SMA | 56.89 | 56.75 | 56.63 | | 35 day SMA | 55.85 | 55.63 | 55.41 | | 50 day SMA | 55.42 | 55.29 | 55.18 | | 100 day SMA | 55.61 | 55.52 | 55.43 | | 150 day SMA | 53.35 | 53.26 | 53.17 | | 200 day SMA | 52.53 | 52.5 | 52.47 |
|
|
