Biocon 532523 full analysis,charts,indicators,moving averages,SMA,DMA,EMA,ADX,MACD,RSIBiocon 532523 WideScreen charts, DMA,SMA,EMA technical analysis, forecast prediction, by indicators ADX,MACD,RSI,CCI BSE stock exchange
Daily price and charts and targets Biocon Strong Daily Stock price targets for Biocon 532523 are 389.65 and 397.05 | Daily Target 1 | 383.67 | | Daily Target 2 | 388.23 | | Daily Target 3 | 391.06666666667 | | Daily Target 4 | 395.63 | | Daily Target 5 | 398.47 |
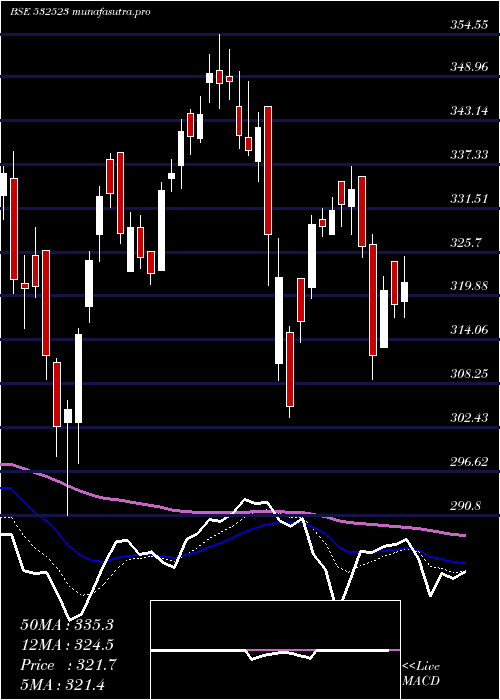
Daily price and volume Biocon
| Date |
Closing |
Open |
Range |
Volume |
Fri 05 December 2025 |
392.80 (1.17%) |
389.80 |
386.50 - 393.90 |
0.4927 times |
Thu 04 December 2025 |
388.25 (-5.34%) |
410.00 |
384.50 - 410.30 |
3.0839 times |
Wed 03 December 2025 |
410.15 (2.5%) |
404.60 |
400.15 - 412.30 |
3.6384 times |
Tue 02 December 2025 |
400.15 (1.43%) |
390.25 |
390.25 - 401.40 |
0.5254 times |
Mon 01 December 2025 |
394.50 (-0.93%) |
398.20 |
393.00 - 400.60 |
0.2345 times |
Fri 28 November 2025 |
398.20 (-0.34%) |
399.70 |
396.45 - 401.70 |
0.3699 times |
Thu 27 November 2025 |
399.55 (0.25%) |
398.95 |
396.80 - 403.55 |
0.6458 times |
Wed 26 November 2025 |
398.55 (1.37%) |
393.20 |
393.20 - 400.00 |
0.4119 times |
Tue 25 November 2025 |
393.15 (-0.38%) |
390.90 |
390.90 - 396.50 |
0.1956 times |
Mon 24 November 2025 |
394.65 (-0.44%) |
397.15 |
392.20 - 401.90 |
0.402 times |
Fri 21 November 2025 |
396.40 (0.29%) |
392.95 |
392.95 - 402.00 |
1.3331 times |
Weekly price and charts Biocon Strong weekly Stock price targets for Biocon 532523 are 374.75 and 402.55 | Weekly Target 1 | 368.73 | | Weekly Target 2 | 380.77 | | Weekly Target 3 | 396.53333333333 | | Weekly Target 4 | 408.57 | | Weekly Target 5 | 424.33 |
Weekly price and volumes for Biocon
| Date |
Closing |
Open |
Range |
Volume |
Fri 05 December 2025 |
392.80 (-1.36%) |
398.20 |
384.50 - 412.30 |
1.7801 times |
Fri 28 November 2025 |
398.20 (0.45%) |
397.15 |
390.90 - 403.55 |
0.452 times |
Fri 21 November 2025 |
396.40 (-3.55%) |
413.65 |
391.45 - 424.95 |
1.1874 times |
Fri 14 November 2025 |
411.00 (8.12%) |
378.60 |
377.00 - 423.05 |
2.7543 times |
Fri 07 November 2025 |
380.15 (2.19%) |
374.95 |
372.65 - 386.80 |
0.5518 times |
Fri 31 October 2025 |
372.00 (2.66%) |
359.20 |
358.75 - 380.45 |
0.6741 times |
Thu 23 October 2025 |
362.35 (1.77%) |
361.90 |
357.05 - 369.25 |
0.4501 times |
Fri 17 October 2025 |
356.05 (0.89%) |
350.95 |
343.00 - 361.15 |
0.4589 times |
Fri 10 October 2025 |
352.90 (0.23%) |
347.20 |
344.60 - 357.65 |
1.3524 times |
Fri 03 October 2025 |
352.10 (3.86%) |
339.15 |
337.20 - 352.85 |
0.3388 times |
Fri 26 September 2025 |
339.00 (-8.19%) |
368.05 |
337.90 - 369.90 |
0.4709 times |

Monthly price and charts Biocon Strong monthly Stock price targets for Biocon 532523 are 374.75 and 402.55 | Monthly Target 1 | 368.73 | | Monthly Target 2 | 380.77 | | Monthly Target 3 | 396.53333333333 | | Monthly Target 4 | 408.57 | | Monthly Target 5 | 424.33 |
Monthly price and volumes Biocon
| Date |
Closing |
Open |
Range |
Volume |
Fri 05 December 2025 |
392.80 (-1.36%) |
398.20 |
384.50 - 412.30 |
0.4844 times |
Fri 28 November 2025 |
398.20 (7.04%) |
374.95 |
372.65 - 424.95 |
1.3457 times |
Fri 31 October 2025 |
372.00 (9.14%) |
340.20 |
340.20 - 380.45 |
0.8448 times |
Tue 30 September 2025 |
340.85 (-2.14%) |
348.65 |
337.20 - 374.00 |
0.6763 times |
Fri 29 August 2025 |
348.30 (-10.94%) |
391.15 |
331.00 - 391.65 |
0.7487 times |
Thu 31 July 2025 |
391.10 (9.98%) |
356.05 |
354.15 - 405.90 |
1.7062 times |
Mon 30 June 2025 |
355.60 (5.98%) |
338.80 |
327.75 - 364.65 |
1.596 times |
Fri 30 May 2025 |
335.55 (4.31%) |
324.90 |
317.70 - 349.80 |
0.9471 times |
Wed 30 April 2025 |
321.70 (-5.72%) |
340.90 |
303.85 - 348.30 |
0.7125 times |
Fri 28 March 2025 |
341.20 (12.76%) |
303.05 |
290.80 - 354.55 |
0.9383 times |
Fri 28 February 2025 |
302.60 (-16.54%) |
362.25 |
298.55 - 399.45 |
1.0276 times |

DMA SMA EMA moving averages of Biocon 532523
DMA (daily moving average) of Biocon 532523
| DMA period | DMA value | | 5 day DMA | 397.17 | | 12 day DMA | 396.8 | | 20 day DMA | 399.32 | | 35 day DMA | 385.47 | | 50 day DMA | 374.9 | | 100 day DMA | 372.66 | | 150 day DMA | 363.08 | | 200 day DMA | 356.57 | EMA (exponential moving average) of Biocon 532523
| EMA period | EMA current | EMA prev | EMA prev2 | | 5 day EMA | 395.95 | 397.53 | 402.17 | | 12 day EMA | 397.02 | 397.79 | 399.52 | | 20 day EMA | 394.4 | 394.57 | 395.24 | | 35 day EMA | 386.35 | 385.97 | 385.84 | | 50 day EMA | 376.05 | 375.37 | 374.84 |
SMA (simple moving average) of Biocon 532523
| SMA period | SMA current | SMA prev | SMA prev2 | | 5 day SMA | 397.17 | 398.25 | 400.51 | | 12 day SMA | 396.8 | 399.2 | 401.95 | | 20 day SMA | 399.32 | 398.93 | 398.53 | | 35 day SMA | 385.47 | 384.23 | 383.22 | | 50 day SMA | 374.9 | 374.43 | 374.03 | | 100 day SMA | 372.66 | 372.46 | 372.27 | | 150 day SMA | 363.08 | 362.6 | 362.09 | | 200 day SMA | 356.57 | 356.43 | 356.3 |
|
|
