IndraGas 532514 full analysis,charts,indicators,moving averages,SMA,DMA,EMA,ADX,MACD,RSIIndra Gas 532514 WideScreen charts, DMA,SMA,EMA technical analysis, forecast prediction, by indicators ADX,MACD,RSI,CCI BSE stock exchange
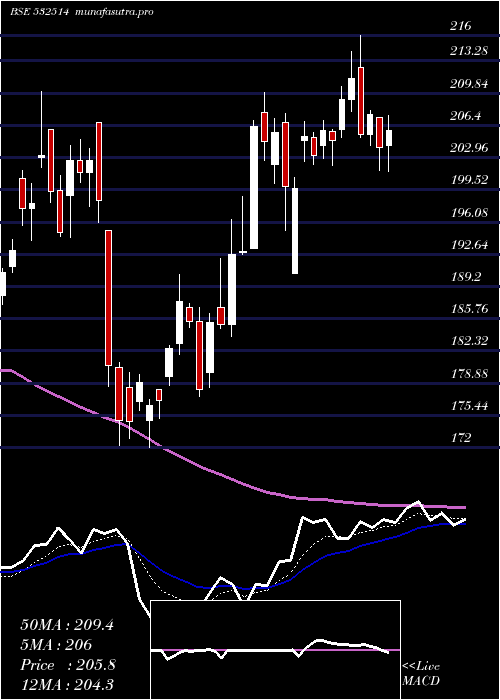
Daily price and charts and targets IndraGas Strong Daily Stock price targets for IndraGas 532514 are 203.65 and 209.55 | Daily Target 1 | 199 | | Daily Target 2 | 202.4 | | Daily Target 3 | 204.9 | | Daily Target 4 | 208.3 | | Daily Target 5 | 210.8 |
Daily price and volume Indra Gas
| Date |
Closing |
Open |
Range |
Volume |
Fri 23 May 2025 |
205.80 (0.88%) |
204.20 |
201.50 - 207.40 |
0.6496 times |
Thu 22 May 2025 |
204.00 (-1.71%) |
207.25 |
201.55 - 207.25 |
0.8666 times |
Wed 21 May 2025 |
207.55 (1.02%) |
205.45 |
204.20 - 207.95 |
1.0773 times |
Tue 20 May 2025 |
205.45 (-2.84%) |
212.55 |
205.05 - 216.00 |
1.063 times |
Mon 19 May 2025 |
211.45 (1.12%) |
209.10 |
207.85 - 214.25 |
0.9872 times |
Fri 16 May 2025 |
209.10 (2.12%) |
206.00 |
205.15 - 210.60 |
1.6739 times |
Thu 15 May 2025 |
204.75 (-0.53%) |
205.75 |
202.15 - 206.00 |
1.4162 times |
Wed 14 May 2025 |
205.85 (1.3%) |
204.20 |
202.90 - 206.95 |
0.7281 times |
Tue 13 May 2025 |
203.20 (-0.97%) |
205.05 |
202.20 - 205.60 |
0.5646 times |
Mon 12 May 2025 |
205.20 (2.75%) |
204.80 |
202.50 - 206.80 |
0.9734 times |
Fri 09 May 2025 |
199.70 (-0.1%) |
190.60 |
190.60 - 200.80 |
2.4163 times |
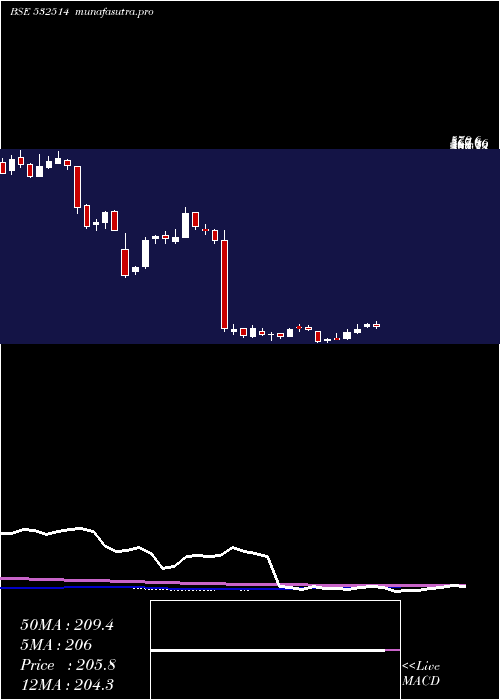
Weekly price and charts IndraGas Strong weekly Stock price targets for IndraGas 532514 are 196.4 and 210.9 | Weekly Target 1 | 193.27 | | Weekly Target 2 | 199.53 | | Weekly Target 3 | 207.76666666667 | | Weekly Target 4 | 214.03 | | Weekly Target 5 | 222.27 |
Weekly price and volumes for Indra Gas
| Date |
Closing |
Open |
Range |
Volume |
Fri 23 May 2025 |
205.80 (-1.58%) |
209.10 |
201.50 - 216.00 |
0.4066 times |
Fri 16 May 2025 |
209.10 (4.71%) |
204.80 |
202.15 - 210.60 |
0.4689 times |
Fri 09 May 2025 |
199.70 (3.5%) |
193.25 |
190.60 - 209.90 |
2.0079 times |
Fri 02 May 2025 |
192.95 (8.28%) |
180.05 |
178.40 - 198.75 |
2.8578 times |
Fri 25 April 2025 |
178.20 (0.62%) |
179.60 |
177.50 - 190.45 |
1.0039 times |
Thu 17 April 2025 |
177.10 (1.34%) |
176.95 |
172.00 - 179.80 |
0.6008 times |
Fri 11 April 2025 |
174.75 (-11.92%) |
195.20 |
172.20 - 195.20 |
0.937 times |
Fri 04 April 2025 |
198.40 (-2.12%) |
202.65 |
196.00 - 206.75 |
0.3352 times |
Fri 28 March 2025 |
202.70 (2.35%) |
203.00 |
194.45 - 210.00 |
0.7013 times |
Fri 21 March 2025 |
198.05 (7.14%) |
184.85 |
184.20 - 201.60 |
0.6807 times |
Thu 13 March 2025 |
184.85 (-1.91%) |
190.30 |
181.20 - 190.50 |
0.1961 times |
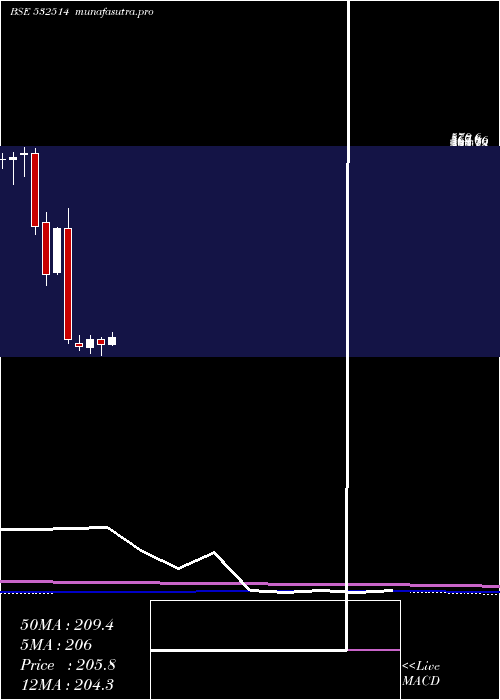
Monthly price and charts IndraGas Strong monthly Stock price targets for IndraGas 532514 are 198.2 and 223.6 | Monthly Target 1 | 178.73 | | Monthly Target 2 | 192.27 | | Monthly Target 3 | 204.13333333333 | | Monthly Target 4 | 217.67 | | Monthly Target 5 | 229.53 |
Monthly price and volumes Indra Gas
| Date |
Closing |
Open |
Range |
Volume |
Fri 23 May 2025 |
205.80 (6.83%) |
192.85 |
190.60 - 216.00 |
0.8449 times |
Wed 30 April 2025 |
192.65 (-4.96%) |
202.65 |
172.00 - 206.75 |
1.3063 times |
Fri 28 March 2025 |
202.70 (6.97%) |
187.90 |
176.05 - 210.00 |
0.5537 times |
Fri 28 February 2025 |
189.50 (-6.12%) |
194.35 |
181.45 - 209.55 |
0.6089 times |
Fri 31 January 2025 |
201.85 (-51.46%) |
416.00 |
195.30 - 453.35 |
1.1919 times |
Tue 31 December 2024 |
415.85 (26.88%) |
330.75 |
326.20 - 417.80 |
2.1173 times |
Fri 29 November 2024 |
327.75 (-21.99%) |
426.80 |
306.50 - 445.75 |
1.6964 times |
Thu 31 October 2024 |
420.15 (-24.81%) |
560.05 |
404.00 - 569.25 |
0.9301 times |
Mon 30 September 2024 |
558.80 (1.15%) |
556.70 |
515.70 - 570.60 |
0.4734 times |
Fri 30 August 2024 |
552.45 (0.81%) |
548.65 |
500.05 - 560.65 |
0.277 times |
Wed 31 July 2024 |
548.00 (8.76%) |
505.50 |
503.00 - 559.85 |
0.6278 times |
DMA SMA EMA moving averages of Indra Gas 532514
DMA (daily moving average) of Indra Gas 532514
| DMA period | DMA value | | 5 day DMA | 206.85 | | 12 day DMA | 205.16 | | 20 day DMA | 200.65 | | 35 day DMA | 195.17 | | 50 day DMA | 193.32 | | 100 day DMA | 256.46 | | 150 day DMA | 308.08 | | 200 day DMA | 366.57 | EMA (exponential moving average) of Indra Gas 532514
| EMA period | EMA current | EMA prev | EMA prev2 | | 5 day EMA | 205.97 | 206.06 | 207.09 | | 12 day EMA | 204.32 | 204.05 | 204.06 | | 20 day EMA | 201.48 | 201.03 | 200.72 | | 35 day EMA | 198.52 | 198.09 | 197.74 | | 50 day EMA | 194.91 | 194.47 | 194.08 |
SMA (simple moving average) of Indra Gas 532514
| SMA period | SMA current | SMA prev | SMA prev2 | | 5 day SMA | 206.85 | 207.51 | 207.66 | | 12 day SMA | 205.16 | 205.15 | 205.21 | | 20 day SMA | 200.65 | 199.63 | 198.81 | | 35 day SMA | 195.17 | 195.1 | 194.93 | | 50 day SMA | 193.32 | 193 | 192.84 | | 100 day SMA | 256.46 | 258.38 | 260.16 | | 150 day SMA | 308.08 | 310.33 | 312.66 | | 200 day SMA | 366.57 | 368.29 | 369.94 |
|
|
