ShalimarWir 532455 full analysis,charts,indicators,moving averages,SMA,DMA,EMA,ADX,MACD,RSIShalimar Wir 532455 WideScreen charts, DMA,SMA,EMA technical analysis, forecast prediction, by indicators ADX,MACD,RSI,CCI BSE stock exchange
Daily price and charts and targets ShalimarWir Strong Daily Stock price targets for ShalimarWir 532455 are 20.1 and 21.54 | Daily Target 1 | 18.96 | | Daily Target 2 | 19.8 | | Daily Target 3 | 20.4 | | Daily Target 4 | 21.24 | | Daily Target 5 | 21.84 |
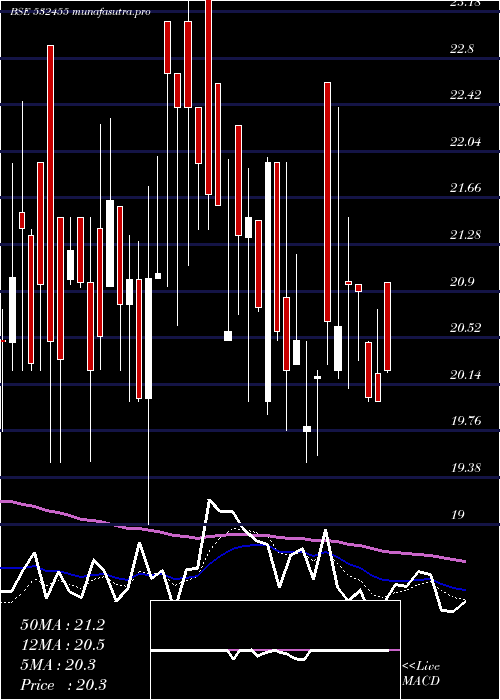
Daily price and volume Shalimar Wir
| Date |
Closing |
Open |
Range |
Volume |
Tue 21 October 2025 |
20.64 (3.46%) |
19.56 |
19.56 - 21.00 |
0.9486 times |
Mon 20 October 2025 |
19.95 (2.62%) |
21.40 |
19.75 - 21.40 |
1.4976 times |
Fri 17 October 2025 |
19.44 (0.52%) |
19.53 |
19.01 - 19.53 |
0.483 times |
Thu 16 October 2025 |
19.34 (1.26%) |
19.48 |
19.00 - 19.75 |
0.5773 times |
Wed 15 October 2025 |
19.10 (-1.14%) |
19.32 |
19.01 - 19.49 |
0.9911 times |
Tue 14 October 2025 |
19.32 (0%) |
19.32 |
19.30 - 19.67 |
0.8006 times |
Mon 13 October 2025 |
19.32 (0.63%) |
19.20 |
19.01 - 19.68 |
0.5761 times |
Fri 10 October 2025 |
19.20 (1.11%) |
19.01 |
18.50 - 19.70 |
1.2936 times |
Thu 09 October 2025 |
18.99 (-2.21%) |
19.00 |
18.90 - 19.99 |
2.5026 times |
Wed 08 October 2025 |
19.42 (-2.26%) |
19.57 |
19.25 - 19.57 |
0.3296 times |
Tue 07 October 2025 |
19.87 (0.51%) |
19.00 |
19.00 - 19.99 |
2.0621 times |
Weekly price and charts ShalimarWir Strong weekly Stock price targets for ShalimarWir 532455 are 19.18 and 21.02 | Weekly Target 1 | 18.69 | | Weekly Target 2 | 19.67 | | Weekly Target 3 | 20.533333333333 | | Weekly Target 4 | 21.51 | | Weekly Target 5 | 22.37 |
Weekly price and volumes for Shalimar Wir
| Date |
Closing |
Open |
Range |
Volume |
Tue 21 October 2025 |
20.64 (6.17%) |
21.40 |
19.56 - 21.40 |
0.3435 times |
Fri 17 October 2025 |
19.44 (1.25%) |
19.20 |
19.00 - 19.75 |
0.4813 times |
Fri 10 October 2025 |
19.20 (-3.52%) |
19.90 |
18.50 - 19.99 |
0.985 times |
Fri 03 October 2025 |
19.90 (-3.26%) |
21.75 |
18.60 - 22.00 |
1.0203 times |
Fri 26 September 2025 |
20.57 (-0.68%) |
20.71 |
20.17 - 21.95 |
0.7647 times |
Fri 19 September 2025 |
20.71 (-2.17%) |
21.17 |
20.00 - 22.50 |
1.3735 times |
Fri 12 September 2025 |
21.17 (0.47%) |
21.69 |
20.32 - 22.00 |
0.8297 times |
Fri 05 September 2025 |
21.07 (9.45%) |
19.50 |
18.43 - 23.90 |
2.7411 times |
Fri 29 August 2025 |
19.25 (-5.59%) |
20.03 |
18.50 - 20.75 |
0.5688 times |
Fri 22 August 2025 |
20.39 (-3.23%) |
20.26 |
20.00 - 21.99 |
0.8922 times |
Thu 14 August 2025 |
21.07 (-0.8%) |
21.24 |
20.00 - 22.00 |
0.4782 times |

Monthly price and charts ShalimarWir Strong monthly Stock price targets for ShalimarWir 532455 are 19.57 and 23.07 | Monthly Target 1 | 16.88 | | Monthly Target 2 | 18.76 | | Monthly Target 3 | 20.38 | | Monthly Target 4 | 22.26 | | Monthly Target 5 | 23.88 |
Monthly price and volumes Shalimar Wir
| Date |
Closing |
Open |
Range |
Volume |
Tue 21 October 2025 |
20.64 (9.32%) |
19.50 |
18.50 - 22.00 |
0.5232 times |
Tue 30 September 2025 |
18.88 (-1.92%) |
19.50 |
18.43 - 23.90 |
1.5187 times |
Fri 29 August 2025 |
19.25 (-12.3%) |
21.11 |
18.50 - 22.00 |
0.6209 times |
Thu 31 July 2025 |
21.95 (-0.14%) |
21.98 |
20.02 - 24.47 |
1.0495 times |
Mon 30 June 2025 |
21.98 (5.93%) |
21.00 |
19.80 - 25.75 |
1.5373 times |
Fri 30 May 2025 |
20.75 (2.47%) |
19.75 |
18.70 - 23.83 |
1.4107 times |
Wed 30 April 2025 |
20.25 (-1.56%) |
22.25 |
19.50 - 22.60 |
0.5212 times |
Fri 28 March 2025 |
20.57 (0.39%) |
21.50 |
19.00 - 23.90 |
0.5951 times |
Fri 28 February 2025 |
20.49 (-12.44%) |
23.75 |
18.43 - 24.00 |
0.8021 times |
Fri 31 January 2025 |
23.40 (0.39%) |
24.14 |
21.01 - 24.89 |
1.4213 times |
Tue 31 December 2024 |
23.31 (5.57%) |
22.70 |
21.05 - 25.23 |
1.211 times |

DMA SMA EMA moving averages of Shalimar Wir 532455
DMA (daily moving average) of Shalimar Wir 532455
| DMA period | DMA value | | 5 day DMA | 19.69 | | 12 day DMA | 19.53 | | 20 day DMA | 19.71 | | 35 day DMA | 20.27 | | 50 day DMA | 20.32 | | 100 day DMA | 21.02 | | 150 day DMA | 20.9 | | 200 day DMA | 21.26 | EMA (exponential moving average) of Shalimar Wir 532455
| EMA period | EMA current | EMA prev | EMA prev2 | | 5 day EMA | 19.91 | 19.54 | 19.34 | | 12 day EMA | 19.71 | 19.54 | 19.47 | | 20 day EMA | 19.83 | 19.74 | 19.72 | | 35 day EMA | 20.03 | 19.99 | 19.99 | | 50 day EMA | 20.35 | 20.34 | 20.36 |
SMA (simple moving average) of Shalimar Wir 532455
| SMA period | SMA current | SMA prev | SMA prev2 | | 5 day SMA | 19.69 | 19.43 | 19.3 | | 12 day SMA | 19.53 | 19.47 | 19.43 | | 20 day SMA | 19.71 | 19.7 | 19.74 | | 35 day SMA | 20.27 | 20.24 | 20.22 | | 50 day SMA | 20.32 | 20.33 | 20.35 | | 100 day SMA | 21.02 | 21.02 | 21.02 | | 150 day SMA | 20.9 | 20.9 | 20.91 | | 200 day SMA | 21.26 | 21.27 | 21.3 |
|
|
