TycheInds 532384 full analysis,charts,indicators,moving averages,SMA,DMA,EMA,ADX,MACD,RSITyche Inds 532384 WideScreen charts, DMA,SMA,EMA technical analysis, forecast prediction, by indicators ADX,MACD,RSI,CCI BSE stock exchange
Daily price and charts and targets TycheInds Strong Daily Stock price targets for TycheInds 532384 are 114.38 and 120.08 | Daily Target 1 | 109.78 | | Daily Target 2 | 113.27 | | Daily Target 3 | 115.48333333333 | | Daily Target 4 | 118.97 | | Daily Target 5 | 121.18 |
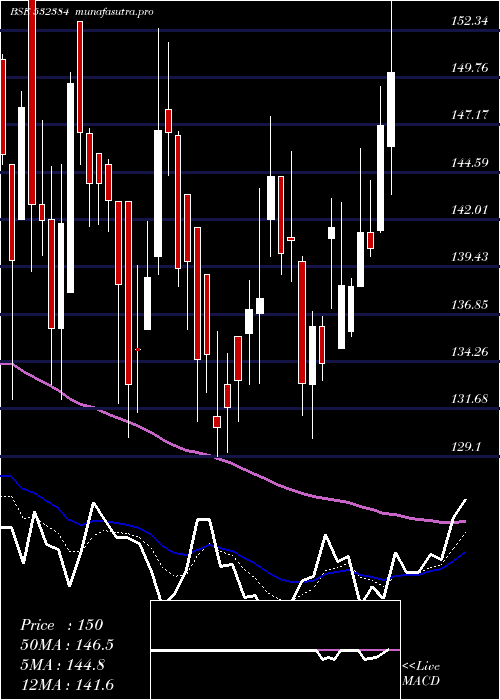
Daily price and volume Tyche Inds
| Date |
Closing |
Open |
Range |
Volume |
Fri 05 December 2025 |
116.75 (2.1%) |
114.35 |
112.00 - 117.70 |
1.6073 times |
Thu 04 December 2025 |
114.35 (-4.27%) |
121.45 |
111.65 - 121.45 |
1.524 times |
Wed 03 December 2025 |
119.45 (-0.95%) |
122.80 |
114.00 - 122.80 |
1.0205 times |
Tue 02 December 2025 |
120.60 (-0.37%) |
123.80 |
119.15 - 123.80 |
0.2235 times |
Mon 01 December 2025 |
121.05 (-0.16%) |
120.90 |
120.45 - 122.95 |
0.1823 times |
Fri 28 November 2025 |
121.25 (-1.06%) |
122.30 |
119.70 - 122.95 |
0.1601 times |
Thu 27 November 2025 |
122.55 (2.68%) |
119.60 |
119.60 - 123.55 |
0.3374 times |
Wed 26 November 2025 |
119.35 (-1.69%) |
123.35 |
116.85 - 123.55 |
1.2014 times |
Tue 25 November 2025 |
121.40 (1%) |
122.70 |
120.95 - 125.80 |
2.3843 times |
Mon 24 November 2025 |
120.20 (-0.46%) |
123.25 |
120.00 - 123.25 |
1.3592 times |
Fri 21 November 2025 |
120.75 (-0.21%) |
122.85 |
119.30 - 122.85 |
1.2255 times |
Weekly price and charts TycheInds Strong weekly Stock price targets for TycheInds 532384 are 108.13 and 120.28 | Weekly Target 1 | 105.25 | | Weekly Target 2 | 111 | | Weekly Target 3 | 117.4 | | Weekly Target 4 | 123.15 | | Weekly Target 5 | 129.55 |
Weekly price and volumes for Tyche Inds
| Date |
Closing |
Open |
Range |
Volume |
Fri 05 December 2025 |
116.75 (-3.71%) |
120.90 |
111.65 - 123.80 |
0.5498 times |
Fri 28 November 2025 |
121.25 (0.41%) |
123.25 |
116.85 - 125.80 |
0.6566 times |
Fri 21 November 2025 |
120.75 (-6.58%) |
128.30 |
118.55 - 132.00 |
1.0844 times |
Fri 14 November 2025 |
129.25 (3.44%) |
125.60 |
123.00 - 135.60 |
1.2672 times |
Fri 07 November 2025 |
124.95 (-5.48%) |
134.00 |
123.95 - 135.00 |
1.7297 times |
Fri 31 October 2025 |
132.20 (0.38%) |
135.00 |
130.00 - 135.00 |
0.981 times |
Thu 23 October 2025 |
131.70 (-4.98%) |
138.60 |
130.00 - 141.50 |
1.2347 times |
Fri 17 October 2025 |
138.60 (-0.43%) |
139.20 |
136.50 - 142.30 |
0.7235 times |
Fri 10 October 2025 |
139.20 (-2.66%) |
139.25 |
138.10 - 145.00 |
1.0792 times |
Fri 03 October 2025 |
143.00 (4.95%) |
136.25 |
136.25 - 145.45 |
0.6938 times |
Fri 26 September 2025 |
136.25 (-4.99%) |
144.10 |
133.75 - 146.00 |
0.8851 times |

Monthly price and charts TycheInds Strong monthly Stock price targets for TycheInds 532384 are 108.13 and 120.28 | Monthly Target 1 | 105.25 | | Monthly Target 2 | 111 | | Monthly Target 3 | 117.4 | | Monthly Target 4 | 123.15 | | Monthly Target 5 | 129.55 |
Monthly price and volumes Tyche Inds
| Date |
Closing |
Open |
Range |
Volume |
Fri 05 December 2025 |
116.75 (-3.71%) |
120.90 |
111.65 - 123.80 |
0.0905 times |
Fri 28 November 2025 |
121.25 (-8.28%) |
134.00 |
116.85 - 135.60 |
0.7798 times |
Fri 31 October 2025 |
132.20 (-5.54%) |
136.60 |
130.00 - 145.45 |
0.7524 times |
Tue 30 September 2025 |
139.95 (4.83%) |
136.20 |
132.15 - 146.00 |
0.6658 times |
Fri 29 August 2025 |
133.50 (-4.68%) |
140.05 |
130.00 - 141.10 |
0.3595 times |
Thu 31 July 2025 |
140.05 (-1.65%) |
142.00 |
136.60 - 148.80 |
0.8191 times |
Mon 30 June 2025 |
142.40 (2.08%) |
138.40 |
134.10 - 147.00 |
1.1522 times |
Fri 30 May 2025 |
139.50 (-3.06%) |
145.50 |
133.00 - 154.20 |
1.6298 times |
Wed 30 April 2025 |
143.90 (8.15%) |
133.00 |
130.05 - 158.00 |
1.2055 times |
Fri 28 March 2025 |
133.05 (-3.9%) |
143.00 |
129.10 - 152.40 |
2.5455 times |
Fri 28 February 2025 |
138.45 (-7.08%) |
149.70 |
132.00 - 161.45 |
1.095 times |

DMA SMA EMA moving averages of Tyche Inds 532384
DMA (daily moving average) of Tyche Inds 532384
| DMA period | DMA value | | 5 day DMA | 118.44 | | 12 day DMA | 119.89 | | 20 day DMA | 123.36 | | 35 day DMA | 128.11 | | 50 day DMA | 131.84 | | 100 day DMA | 135.32 | | 150 day DMA | 137.8 | | 200 day DMA | 138.99 | EMA (exponential moving average) of Tyche Inds 532384
| EMA period | EMA current | EMA prev | EMA prev2 | | 5 day EMA | 117.9 | 118.48 | 120.54 | | 12 day EMA | 120.42 | 121.09 | 122.31 | | 20 day EMA | 123 | 123.66 | 124.64 | | 35 day EMA | 127.13 | 127.74 | 128.53 | | 50 day EMA | 131.33 | 131.92 | 132.64 |
SMA (simple moving average) of Tyche Inds 532384
| SMA period | SMA current | SMA prev | SMA prev2 | | 5 day SMA | 118.44 | 119.34 | 120.98 | | 12 day SMA | 119.89 | 120.31 | 121.15 | | 20 day SMA | 123.36 | 124.18 | 125.16 | | 35 day SMA | 128.11 | 128.74 | 129.45 | | 50 day SMA | 131.84 | 132.37 | 132.93 | | 100 day SMA | 135.32 | 135.57 | 135.84 | | 150 day SMA | 137.8 | 138.01 | 138.23 | | 200 day SMA | 138.99 | 139.14 | 139.32 |
|
|
