Bcg 532368 full analysis,charts,indicators,moving averages,SMA,DMA,EMA,ADX,MACD,RSIBcg 532368 WideScreen charts, DMA,SMA,EMA technical analysis, forecast prediction, by indicators ADX,MACD,RSI,CCI BSE stock exchange
Daily price and charts and targets Bcg Strong Daily Stock price targets for Bcg 532368 are 15.45 and 16.09 | Daily Target 1 | 15.33 | | Daily Target 2 | 15.56 | | Daily Target 3 | 15.973333333333 | | Daily Target 4 | 16.2 | | Daily Target 5 | 16.61 |
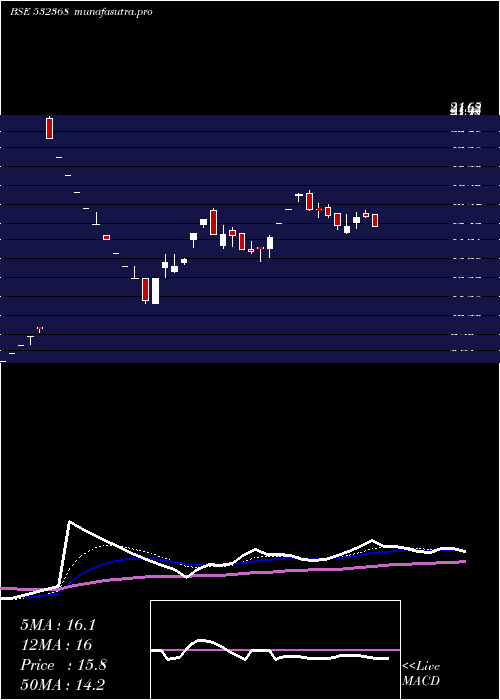
Daily price and volume Bcg
| Date |
Closing |
Open |
Range |
Volume |
Tue 02 September 2025 |
15.78 (-3.25%) |
16.39 |
15.75 - 16.39 |
0.3688 times |
Mon 01 September 2025 |
16.31 (0.43%) |
16.44 |
16.23 - 16.64 |
0.3984 times |
Fri 29 August 2025 |
16.24 (3.24%) |
15.97 |
15.66 - 16.51 |
0.9908 times |
Thu 28 August 2025 |
15.73 (-0.38%) |
15.43 |
15.37 - 16.38 |
0.4618 times |
Tue 26 August 2025 |
15.79 (-3.54%) |
16.48 |
15.61 - 16.48 |
0.6086 times |
Mon 25 August 2025 |
16.37 (-1.68%) |
16.77 |
16.25 - 16.92 |
0.3973 times |
Fri 22 August 2025 |
16.65 (-0.18%) |
16.69 |
16.23 - 17.01 |
0.4384 times |
Thu 21 August 2025 |
16.68 (-4.63%) |
17.55 |
16.62 - 17.70 |
1.7851 times |
Wed 20 August 2025 |
17.49 (4.79%) |
17.44 |
17.10 - 17.52 |
3.8068 times |
Tue 19 August 2025 |
16.69 (4.97%) |
16.69 |
16.69 - 16.69 |
0.7441 times |
Mon 18 August 2025 |
15.90 (4.95%) |
15.90 |
15.90 - 15.90 |
0.3062 times |
Weekly price and charts Bcg Strong weekly Stock price targets for Bcg 532368 are 15.32 and 16.21 | Weekly Target 1 | 15.17 | | Weekly Target 2 | 15.47 | | Weekly Target 3 | 16.056666666667 | | Weekly Target 4 | 16.36 | | Weekly Target 5 | 16.95 |
Weekly price and volumes for Bcg
| Date |
Closing |
Open |
Range |
Volume |
Tue 02 September 2025 |
15.78 (-2.83%) |
16.44 |
15.75 - 16.64 |
0.2019 times |
Fri 29 August 2025 |
16.24 (-2.46%) |
16.77 |
15.37 - 16.92 |
0.6471 times |
Fri 22 August 2025 |
16.65 (9.9%) |
15.90 |
15.90 - 17.70 |
1.8636 times |
Thu 14 August 2025 |
15.15 (-0.72%) |
15.36 |
13.87 - 15.36 |
0.5927 times |
Fri 08 August 2025 |
15.26 (9.23%) |
15.08 |
14.56 - 16.71 |
1.411 times |
Fri 01 August 2025 |
13.97 (7.96%) |
12.94 |
11.61 - 14.24 |
1.6399 times |
Fri 25 July 2025 |
12.94 (-22.51%) |
15.87 |
12.94 - 16.50 |
2.6522 times |
Fri 18 July 2025 |
16.70 (62.45%) |
21.55 |
16.70 - 21.65 |
0.3826 times |
Mon 30 December 2024 |
10.28 (4.58%) |
10.32 |
10.07 - 10.32 |
0.2771 times |
Mon 23 December 2024 |
9.83 (4.91%) |
9.83 |
9.45 - 9.83 |
0.3318 times |
Mon 16 December 2024 |
9.37 (4.93%) |
9.37 |
9.37 - 9.37 |
0.0433 times |

Monthly price and charts Bcg Strong monthly Stock price targets for Bcg 532368 are 15.32 and 16.21 | Monthly Target 1 | 15.17 | | Monthly Target 2 | 15.47 | | Monthly Target 3 | 16.056666666667 | | Monthly Target 4 | 16.36 | | Monthly Target 5 | 16.95 |
Monthly price and volumes Bcg
| Date |
Closing |
Open |
Range |
Volume |
Tue 02 September 2025 |
15.78 (-2.83%) |
16.44 |
15.75 - 16.64 |
0.143 times |
Fri 29 August 2025 |
16.24 (19.32%) |
13.83 |
13.70 - 17.70 |
3.3444 times |
Thu 31 July 2025 |
13.61 (32.39%) |
21.55 |
11.61 - 21.65 |
3.165 times |
Mon 30 December 2024 |
10.28 (26.76%) |
8.51 |
8.51 - 10.32 |
0.5211 times |
Mon 25 November 2024 |
8.11 (-0.25%) |
8.13 |
7.72 - 8.94 |
0.2949 times |
Mon 28 October 2024 |
8.13 (-18.37%) |
9.97 |
8.13 - 10.25 |
0.1761 times |
Mon 30 September 2024 |
9.96 (23.57%) |
8.46 |
8.46 - 10.26 |
0.8654 times |
Mon 26 August 2024 |
8.06 (9.81%) |
6.98 |
6.65 - 8.06 |
0.7657 times |
Mon 29 July 2024 |
7.34 (-22.33%) |
8.98 |
7.34 - 8.98 |
0.089 times |
Fri 14 June 2024 |
9.45 (-14.63%) |
10.52 |
9.45 - 11.30 |
0.6352 times |
Fri 31 May 2024 |
11.07 (-20.59%) |
13.94 |
8.59 - 14.15 |
0.958 times |

DMA SMA EMA moving averages of Bcg 532368
DMA (daily moving average) of Bcg 532368
| DMA period | DMA value | | 5 day DMA | 15.97 | | 12 day DMA | 16.23 | | 20 day DMA | 15.78 | | 35 day DMA | 15.61 | | 50 day DMA | 13.61 | | 100 day DMA | 12.2 | | 150 day DMA | 13.71 | | 200 day DMA | 15.08 | EMA (exponential moving average) of Bcg 532368
| EMA period | EMA current | EMA prev | EMA prev2 | | 5 day EMA | 16.05 | 16.19 | 16.13 | | 12 day EMA | 15.97 | 16 | 15.94 | | 20 day EMA | 15.62 | 15.6 | 15.52 | | 35 day EMA | 14.56 | 14.49 | 14.38 | | 50 day EMA | 13.42 | 13.32 | 13.2 |
SMA (simple moving average) of Bcg 532368
| SMA period | SMA current | SMA prev | SMA prev2 | | 5 day SMA | 15.97 | 16.09 | 16.16 | | 12 day SMA | 16.23 | 16.13 | 15.97 | | 20 day SMA | 15.78 | 15.69 | 15.56 | | 35 day SMA | 15.61 | 15.45 | 15.27 | | 50 day SMA | 13.61 | 13.48 | 13.34 | | 100 day SMA | 12.2 | 12.19 | 12.18 | | 150 day SMA | 13.71 | 13.74 | 13.76 | | 200 day SMA | 15.08 | 15.09 | 15.09 |
|
|
