PadmalayaTe 532350 full analysis,charts,indicators,moving averages,SMA,DMA,EMA,ADX,MACD,RSIPadmalaya Te 532350 WideScreen charts, DMA,SMA,EMA technical analysis, forecast prediction, by indicators ADX,MACD,RSI,CCI BSE stock exchange
Daily price and charts and targets PadmalayaTe Strong Daily Stock price targets for PadmalayaTe 532350 are 3.93 and 4.13 | Daily Target 1 | 3.89 | | Daily Target 2 | 3.97 | | Daily Target 3 | 4.0866666666667 | | Daily Target 4 | 4.17 | | Daily Target 5 | 4.29 |
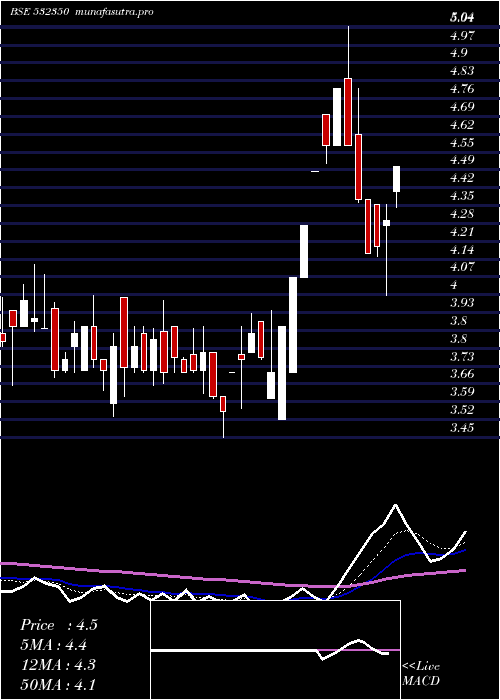
Daily price and volume Padmalaya Te
| Date |
Closing |
Open |
Range |
Volume |
Tue 21 October 2025 |
4.06 (0.74%) |
4.20 |
4.00 - 4.20 |
1.0417 times |
Mon 20 October 2025 |
4.03 (0.75%) |
4.08 |
3.95 - 4.20 |
0.302 times |
Fri 17 October 2025 |
4.00 (-1.72%) |
4.08 |
4.00 - 4.08 |
0.3098 times |
Thu 16 October 2025 |
4.07 (0.25%) |
4.24 |
4.07 - 4.24 |
0.3349 times |
Wed 15 October 2025 |
4.06 (-2.17%) |
4.35 |
4.02 - 4.35 |
1.418 times |
Tue 14 October 2025 |
4.15 (-1.19%) |
4.00 |
4.00 - 4.20 |
0.4476 times |
Mon 13 October 2025 |
4.20 (-3.89%) |
4.37 |
4.16 - 4.37 |
4.4232 times |
Fri 10 October 2025 |
4.37 (4.05%) |
4.10 |
4.10 - 4.38 |
0.1867 times |
Thu 09 October 2025 |
4.20 (4.22%) |
4.05 |
4.05 - 4.23 |
1.1452 times |
Wed 08 October 2025 |
4.03 (-4.5%) |
4.23 |
4.01 - 4.23 |
0.3909 times |
Tue 07 October 2025 |
4.22 (-1.63%) |
4.24 |
4.21 - 4.48 |
0.379 times |
Weekly price and charts PadmalayaTe Strong weekly Stock price targets for PadmalayaTe 532350 are 3.88 and 4.13 | Weekly Target 1 | 3.82 | | Weekly Target 2 | 3.94 | | Weekly Target 3 | 4.07 | | Weekly Target 4 | 4.19 | | Weekly Target 5 | 4.32 |
Weekly price and volumes for Padmalaya Te
| Date |
Closing |
Open |
Range |
Volume |
Tue 21 October 2025 |
4.06 (1.5%) |
4.08 |
3.95 - 4.20 |
0.288 times |
Fri 17 October 2025 |
4.00 (-8.47%) |
4.37 |
4.00 - 4.37 |
1.4858 times |
Fri 10 October 2025 |
4.37 (-0.68%) |
4.50 |
4.01 - 4.58 |
0.6946 times |
Fri 03 October 2025 |
4.40 (-2.22%) |
4.60 |
4.30 - 4.90 |
0.6133 times |
Fri 26 September 2025 |
4.50 (-7.79%) |
4.88 |
4.46 - 4.95 |
0.6663 times |
Fri 19 September 2025 |
4.88 (1.04%) |
4.95 |
4.51 - 4.97 |
1.0256 times |
Fri 12 September 2025 |
4.83 (2.77%) |
4.79 |
4.52 - 5.22 |
1.3331 times |
Fri 05 September 2025 |
4.70 (12.98%) |
4.35 |
4.00 - 4.81 |
0.7997 times |
Fri 29 August 2025 |
4.16 (-9.17%) |
4.58 |
4.16 - 5.04 |
1.4035 times |
Fri 22 August 2025 |
4.58 (23.78%) |
3.52 |
3.52 - 4.70 |
1.6902 times |
Thu 14 August 2025 |
3.70 (0%) |
3.77 |
3.56 - 3.94 |
0.3882 times |

Monthly price and charts PadmalayaTe Strong monthly Stock price targets for PadmalayaTe 532350 are 3.65 and 4.37 | Monthly Target 1 | 3.51 | | Monthly Target 2 | 3.78 | | Monthly Target 3 | 4.2266666666667 | | Monthly Target 4 | 4.5 | | Monthly Target 5 | 4.95 |
Monthly price and volumes Padmalaya Te
| Date |
Closing |
Open |
Range |
Volume |
Tue 21 October 2025 |
4.06 (-10.96%) |
4.65 |
3.95 - 4.67 |
0.6876 times |
Tue 30 September 2025 |
4.56 (9.62%) |
4.35 |
4.00 - 5.22 |
0.9483 times |
Fri 29 August 2025 |
4.16 (10.64%) |
3.75 |
3.45 - 5.04 |
0.9307 times |
Thu 31 July 2025 |
3.76 (-7.62%) |
4.07 |
3.53 - 4.30 |
0.9439 times |
Mon 30 June 2025 |
4.07 (1.75%) |
4.14 |
3.70 - 4.28 |
1.3315 times |
Fri 30 May 2025 |
4.00 (3.09%) |
3.70 |
3.42 - 4.55 |
0.8927 times |
Wed 30 April 2025 |
3.88 (-16.92%) |
4.90 |
3.79 - 4.90 |
0.6537 times |
Fri 28 March 2025 |
4.67 (1.52%) |
4.69 |
4.32 - 5.35 |
1.1985 times |
Fri 28 February 2025 |
4.60 (-19.44%) |
5.99 |
4.28 - 6.80 |
0.676 times |
Fri 31 January 2025 |
5.71 (-27.54%) |
7.73 |
5.40 - 7.73 |
1.7372 times |
Tue 31 December 2024 |
7.88 (-9.74%) |
8.30 |
6.13 - 9.04 |
6.0892 times |

DMA SMA EMA moving averages of Padmalaya Te 532350
DMA (daily moving average) of Padmalaya Te 532350
| DMA period | DMA value | | 5 day DMA | 4.04 | | 12 day DMA | 4.14 | | 20 day DMA | 4.34 | | 35 day DMA | 4.53 | | 50 day DMA | 4.41 | | 100 day DMA | 4.15 | | 150 day DMA | 4.2 | | 200 day DMA | 4.69 | EMA (exponential moving average) of Padmalaya Te 532350
| EMA period | EMA current | EMA prev | EMA prev2 | | 5 day EMA | 4.07 | 4.07 | 4.09 | | 12 day EMA | 4.17 | 4.19 | 4.22 | | 20 day EMA | 4.27 | 4.29 | 4.32 | | 35 day EMA | 4.3 | 4.31 | 4.33 | | 50 day EMA | 4.32 | 4.33 | 4.34 |
SMA (simple moving average) of Padmalaya Te 532350
| SMA period | SMA current | SMA prev | SMA prev2 | | 5 day SMA | 4.04 | 4.06 | 4.1 | | 12 day SMA | 4.14 | 4.17 | 4.21 | | 20 day SMA | 4.34 | 4.38 | 4.42 | | 35 day SMA | 4.53 | 4.53 | 4.53 | | 50 day SMA | 4.41 | 4.4 | 4.39 | | 100 day SMA | 4.15 | 4.15 | 4.15 | | 150 day SMA | 4.2 | 4.21 | 4.21 | | 200 day SMA | 4.69 | 4.71 | 4.74 |
|
|
