SoftsolI 532344 full analysis,charts,indicators,moving averages,SMA,DMA,EMA,ADX,MACD,RSISoftsol I 532344 WideScreen charts, DMA,SMA,EMA technical analysis, forecast prediction, by indicators ADX,MACD,RSI,CCI BSE stock exchange
Daily price and charts and targets SoftsolI Strong Daily Stock price targets for SoftsolI 532344 are 208.03 and 224.78 | Daily Target 1 | 203.77 | | Daily Target 2 | 212.28 | | Daily Target 3 | 220.51666666667 | | Daily Target 4 | 229.03 | | Daily Target 5 | 237.27 |
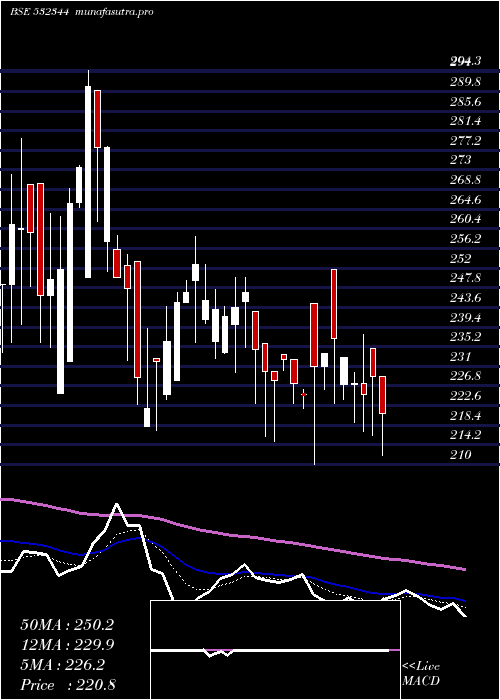
Daily price and volume Softsol I
| Date |
Closing |
Open |
Range |
Volume |
| Wed 30 April 2025 |
220.80 (-3.48%) |
228.75 |
212.00 - 228.75 |
0.7158 times |
| Tue 29 April 2025 |
228.75 (1.67%) |
234.85 |
216.10 - 234.85 |
0.1006 times |
| Mon 28 April 2025 |
225.00 (-1.01%) |
227.30 |
217.10 - 237.75 |
0.24 times |
| Fri 25 April 2025 |
227.30 (-2.4%) |
227.10 |
218.90 - 229.60 |
0.9363 times |
| Thu 24 April 2025 |
232.90 (-1.67%) |
227.00 |
224.00 - 232.95 |
1.4164 times |
| Tue 22 April 2025 |
236.85 (1.35%) |
251.80 |
223.00 - 251.80 |
0.4314 times |
| Mon 21 April 2025 |
233.70 (1.15%) |
231.05 |
226.00 - 233.70 |
0.5417 times |
| Thu 17 April 2025 |
231.05 (2.73%) |
244.45 |
210.00 - 244.45 |
3.2047 times |
| Wed 16 April 2025 |
224.90 (-1.03%) |
225.00 |
221.90 - 226.00 |
0.6412 times |
| Tue 15 April 2025 |
227.25 (-2.24%) |
232.45 |
223.00 - 232.45 |
1.7721 times |
| Fri 11 April 2025 |
232.45 (1.97%) |
233.55 |
230.00 - 233.55 |
0.066 times |
Weekly price and charts SoftsolI Strong weekly Stock price targets for SoftsolI 532344 are 203.53 and 229.28 | Weekly Target 1 | 197.77 | | Weekly Target 2 | 209.28 | | Weekly Target 3 | 223.51666666667 | | Weekly Target 4 | 235.03 | | Weekly Target 5 | 249.27 |
Weekly price and volumes for Softsol I
| Date |
Closing |
Open |
Range |
Volume |
| Wed 30 April 2025 |
220.80 (-2.86%) |
227.30 |
212.00 - 237.75 |
0.3344 times |
| Fri 25 April 2025 |
227.30 (-1.62%) |
231.05 |
218.90 - 251.80 |
1.0528 times |
| Thu 17 April 2025 |
231.05 (-0.6%) |
232.45 |
210.00 - 244.45 |
1.7785 times |
| Fri 11 April 2025 |
232.45 (-0.9%) |
235.95 |
215.00 - 235.95 |
0.2071 times |
| Fri 04 April 2025 |
234.55 (-2.94%) |
240.00 |
223.00 - 249.95 |
1.2911 times |
| Fri 28 March 2025 |
241.65 (-2.09%) |
249.25 |
232.75 - 258.70 |
0.8321 times |
| Fri 21 March 2025 |
246.80 (8.01%) |
218.10 |
217.35 - 249.35 |
1.2192 times |
| Thu 13 March 2025 |
228.50 (-17.73%) |
257.65 |
222.85 - 277.95 |
1.7083 times |
| Fri 07 March 2025 |
277.75 (11.32%) |
225.10 |
225.10 - 294.30 |
0.5672 times |
| Fri 28 February 2025 |
249.50 (-4.55%) |
260.35 |
235.00 - 279.80 |
1.0094 times |
| Fri 21 February 2025 |
261.40 (-4.63%) |
264.00 |
233.85 - 272.00 |
0.738 times |

Monthly price and charts SoftsolI Strong monthly Stock price targets for SoftsolI 532344 are 194.5 and 236.3 | Monthly Target 1 | 185.73 | | Monthly Target 2 | 203.27 | | Monthly Target 3 | 227.53333333333 | | Monthly Target 4 | 245.07 | | Monthly Target 5 | 269.33 |
Monthly price and volumes Softsol I
| Date |
Closing |
Open |
Range |
Volume |
| Wed 30 April 2025 |
220.80 (-8.63%) |
240.00 |
210.00 - 251.80 |
0.4348 times |
| Fri 28 March 2025 |
241.65 (-3.15%) |
225.10 |
217.35 - 294.30 |
0.4033 times |
| Fri 28 February 2025 |
249.50 (-12.61%) |
277.20 |
233.85 - 294.45 |
0.2731 times |
| Fri 31 January 2025 |
285.50 (-1.55%) |
280.60 |
260.05 - 302.70 |
0.5387 times |
| Tue 31 December 2024 |
290.00 (-2.75%) |
298.20 |
280.00 - 333.10 |
1.2061 times |
| Fri 29 November 2024 |
298.20 (-25.02%) |
389.75 |
272.65 - 441.95 |
1.3498 times |
| Thu 31 October 2024 |
397.70 (-10.47%) |
466.40 |
397.70 - 556.40 |
0.8766 times |
| Mon 30 September 2024 |
444.20 (10.18%) |
403.15 |
372.55 - 450.00 |
1.4888 times |
| Fri 30 August 2024 |
403.15 (31.75%) |
296.80 |
280.00 - 407.05 |
1.6218 times |
| Wed 31 July 2024 |
306.00 (-9.59%) |
338.45 |
268.60 - 367.85 |
1.807 times |
| Fri 28 June 2024 |
338.45 (45.44%) |
243.90 |
215.00 - 338.45 |
1.9585 times |

DMA SMA EMA moving averages of Softsol I 532344
DMA (daily moving average) of Softsol I 532344
| DMA period | DMA value | | 5 day DMA | 226.95 | | 12 day DMA | 229.08 | | 20 day DMA | 234.31 | | 35 day DMA | 242.32 | | 50 day DMA | 250.05 | | 100 day DMA | 272.55 | | 150 day DMA | 325.61 | | 200 day DMA | 327.85 | EMA (exponential moving average) of Softsol I 532344
| EMA period | EMA current | EMA prev | EMA prev2 | | 5 day EMA | 226.24 | 228.96 | 229.07 | | 12 day EMA | 229.89 | 231.54 | 232.05 | | 20 day EMA | 233.97 | 235.36 | 236.06 | | 35 day EMA | 242.42 | 243.69 | 244.57 | | 50 day EMA | 250.69 | 251.91 | 252.86 |
SMA (simple moving average) of Softsol I 532344
| SMA period | SMA current | SMA prev | SMA prev2 | | 5 day SMA | 226.95 | 230.16 | 231.15 | | 12 day SMA | 229.08 | 229.83 | 230.31 | | 20 day SMA | 234.31 | 235.61 | 236.4 | | 35 day SMA | 242.32 | 243.05 | 243.93 | | 50 day SMA | 250.05 | 251.26 | 252.4 | | 100 day SMA | 272.55 | 273.57 | 274.53 | | 150 day SMA | 325.61 | 326.71 | 327.77 | | 200 day SMA | 327.85 | 328.36 | 328.77 |
|
|
