HbPortfolio 532333 full analysis,charts,indicators,moving averages,SMA,DMA,EMA,ADX,MACD,RSIHb Portfolio 532333 WideScreen charts, DMA,SMA,EMA technical analysis, forecast prediction, by indicators ADX,MACD,RSI,CCI BSE stock exchange
Daily price and charts and targets HbPortfolio Strong Daily Stock price targets for HbPortfolio 532333 are 75.32 and 79.69 | Daily Target 1 | 72.17 | | Daily Target 2 | 74.09 | | Daily Target 3 | 76.543333333333 | | Daily Target 4 | 78.46 | | Daily Target 5 | 80.91 |
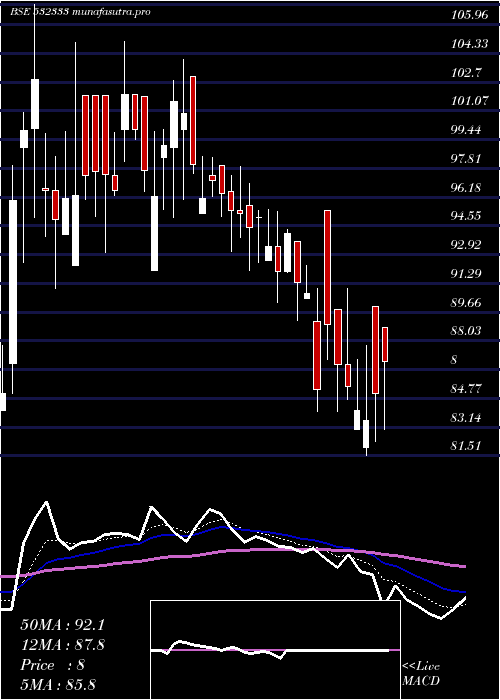
Daily price and volume Hb Portfolio
| Date |
Closing |
Open |
Range |
Volume |
Tue 21 October 2025 |
76.00 (-1.78%) |
75.00 |
74.63 - 79.00 |
0.6956 times |
Mon 20 October 2025 |
77.38 (2.49%) |
73.05 |
73.05 - 77.48 |
0.1784 times |
Fri 17 October 2025 |
75.50 (-4.43%) |
77.00 |
75.50 - 79.44 |
1.3544 times |
Thu 16 October 2025 |
79.00 (4.48%) |
75.61 |
75.45 - 79.74 |
0.2152 times |
Wed 15 October 2025 |
75.61 (-0.54%) |
76.05 |
75.10 - 78.00 |
1.451 times |
Tue 14 October 2025 |
76.02 (-3.22%) |
78.55 |
76.01 - 78.55 |
1.0598 times |
Mon 13 October 2025 |
78.55 (0.72%) |
76.04 |
76.00 - 78.95 |
0.838 times |
Fri 10 October 2025 |
77.99 (-0.43%) |
77.60 |
75.15 - 78.20 |
0.5901 times |
Thu 09 October 2025 |
78.33 (-0.63%) |
78.99 |
78.20 - 80.50 |
0.9264 times |
Wed 08 October 2025 |
78.83 (4.41%) |
78.00 |
76.10 - 79.92 |
2.6909 times |
Tue 07 October 2025 |
75.50 (-1.38%) |
78.00 |
75.00 - 78.00 |
0.8233 times |
Weekly price and charts HbPortfolio Strong weekly Stock price targets for HbPortfolio 532333 are 74.53 and 80.48 | Weekly Target 1 | 70.07 | | Weekly Target 2 | 73.03 | | Weekly Target 3 | 76.016666666667 | | Weekly Target 4 | 78.98 | | Weekly Target 5 | 81.97 |
Weekly price and volumes for Hb Portfolio
| Date |
Closing |
Open |
Range |
Volume |
Tue 21 October 2025 |
76.00 (0.66%) |
73.05 |
73.05 - 79.00 |
0.1584 times |
Fri 17 October 2025 |
75.50 (-3.19%) |
76.04 |
75.10 - 79.74 |
0.8914 times |
Fri 10 October 2025 |
77.99 (-0.88%) |
81.99 |
75.00 - 81.99 |
1.0429 times |
Fri 03 October 2025 |
78.68 (2.29%) |
77.30 |
72.30 - 78.99 |
0.9534 times |
Fri 26 September 2025 |
76.92 (-5.98%) |
83.00 |
75.00 - 84.79 |
0.6686 times |
Fri 19 September 2025 |
81.81 (8.73%) |
71.70 |
71.70 - 88.00 |
1.6719 times |
Fri 12 September 2025 |
75.24 (-2.54%) |
79.97 |
73.30 - 81.99 |
1.6363 times |
Fri 05 September 2025 |
77.20 (2.44%) |
75.75 |
73.00 - 85.95 |
1.0119 times |
Fri 29 August 2025 |
75.36 (-2.7%) |
77.45 |
74.00 - 81.38 |
0.8508 times |
Fri 22 August 2025 |
77.45 (-0.69%) |
80.50 |
73.01 - 81.00 |
1.1144 times |
Thu 14 August 2025 |
77.99 (-9.68%) |
82.04 |
74.10 - 86.90 |
0.813 times |

Monthly price and charts HbPortfolio Strong monthly Stock price targets for HbPortfolio 532333 are 74.15 and 83.84 | Monthly Target 1 | 67.07 | | Monthly Target 2 | 71.54 | | Monthly Target 3 | 76.763333333333 | | Monthly Target 4 | 81.23 | | Monthly Target 5 | 86.45 |
Monthly price and volumes Hb Portfolio
| Date |
Closing |
Open |
Range |
Volume |
Tue 21 October 2025 |
76.00 (0.57%) |
74.78 |
72.30 - 81.99 |
0.4137 times |
Tue 30 September 2025 |
75.57 (0.28%) |
75.75 |
71.70 - 88.00 |
0.7228 times |
Fri 29 August 2025 |
75.36 (-11.39%) |
88.78 |
73.01 - 89.53 |
0.515 times |
Thu 31 July 2025 |
85.05 (-11.59%) |
98.45 |
81.51 - 104.00 |
0.9991 times |
Mon 30 June 2025 |
96.20 (9%) |
86.00 |
84.10 - 107.10 |
1.7125 times |
Fri 30 May 2025 |
88.26 (-1.97%) |
86.01 |
73.51 - 99.00 |
0.9027 times |
Wed 30 April 2025 |
90.03 (4.21%) |
89.90 |
76.60 - 102.90 |
0.8989 times |
Fri 28 March 2025 |
86.39 (-2.11%) |
90.05 |
80.00 - 105.00 |
2.2566 times |
Fri 28 February 2025 |
88.25 (-9.16%) |
105.01 |
75.60 - 109.98 |
0.8953 times |
Fri 31 January 2025 |
97.15 (-7.78%) |
105.35 |
90.20 - 109.00 |
0.6833 times |
Tue 31 December 2024 |
105.35 (2.03%) |
104.90 |
99.10 - 122.55 |
1.611 times |

DMA SMA EMA moving averages of Hb Portfolio 532333
DMA (daily moving average) of Hb Portfolio 532333
| DMA period | DMA value | | 5 day DMA | 76.7 | | 12 day DMA | 77.11 | | 20 day DMA | 76.92 | | 35 day DMA | 77.52 | | 50 day DMA | 77.96 | | 100 day DMA | 85.37 | | 150 day DMA | 87.06 | | 200 day DMA | 90 | EMA (exponential moving average) of Hb Portfolio 532333
| EMA period | EMA current | EMA prev | EMA prev2 | | 5 day EMA | 76.68 | 77.02 | 76.84 | | 12 day EMA | 76.98 | 77.16 | 77.12 | | 20 day EMA | 77.24 | 77.37 | 77.37 | | 35 day EMA | 77.83 | 77.94 | 77.97 | | 50 day EMA | 78.55 | 78.65 | 78.7 |
SMA (simple moving average) of Hb Portfolio 532333
| SMA period | SMA current | SMA prev | SMA prev2 | | 5 day SMA | 76.7 | 76.7 | 76.94 | | 12 day SMA | 77.11 | 77.33 | 77.07 | | 20 day SMA | 76.92 | 77.12 | 77.34 | | 35 day SMA | 77.52 | 77.46 | 77.4 | | 50 day SMA | 77.96 | 78.15 | 78.35 | | 100 day SMA | 85.37 | 85.5 | 85.62 | | 150 day SMA | 87.06 | 87.18 | 87.25 | | 200 day SMA | 90 | 90.16 | 90.33 |
|
|
