Mahindralife 532313 full analysis,charts,indicators,moving averages,SMA,DMA,EMA,ADX,MACD,RSIMahindralife 532313 WideScreen charts, DMA,SMA,EMA technical analysis, forecast prediction, by indicators ADX,MACD,RSI,CCI BSE stock exchange
Daily price and charts and targets Mahindralife Strong Daily Stock price targets for Mahindralife 532313 are 386.38 and 406.28 | Daily Target 1 | 371.23 | | Daily Target 2 | 381.62 | | Daily Target 3 | 391.13333333333 | | Daily Target 4 | 401.52 | | Daily Target 5 | 411.03 |
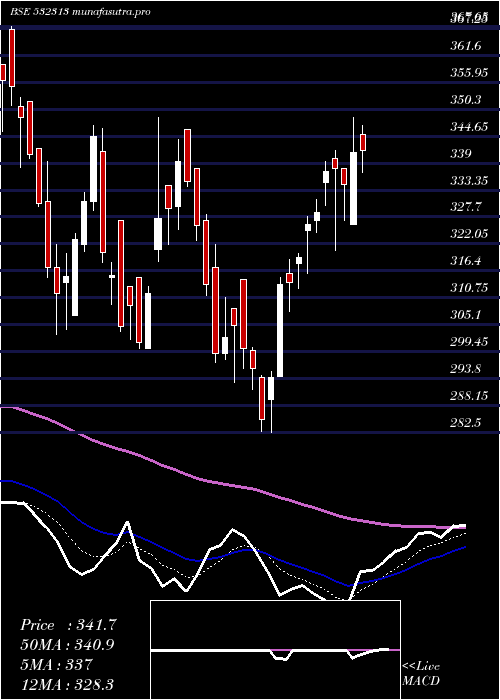
Daily price and volume Mahindralife
| Date |
Closing |
Open |
Range |
Volume |
Tue 21 October 2025 |
392.00 (1.83%) |
389.00 |
380.75 - 400.65 |
0.4745 times |
Mon 20 October 2025 |
384.95 (0.5%) |
380.00 |
379.95 - 386.55 |
2.1811 times |
Fri 17 October 2025 |
383.05 (0.07%) |
383.00 |
380.95 - 387.00 |
0.4137 times |
Thu 16 October 2025 |
382.80 (0.28%) |
381.80 |
381.40 - 386.55 |
0.8761 times |
Wed 15 October 2025 |
381.75 (3.74%) |
370.00 |
367.00 - 387.00 |
1.052 times |
Tue 14 October 2025 |
368.00 (-1.79%) |
372.95 |
364.75 - 374.25 |
0.2816 times |
Mon 13 October 2025 |
374.70 (1.35%) |
371.55 |
371.55 - 383.30 |
3.0685 times |
Fri 10 October 2025 |
369.70 (3.63%) |
355.65 |
355.60 - 373.95 |
0.9884 times |
Thu 09 October 2025 |
356.75 (-0.56%) |
355.05 |
354.75 - 359.95 |
0.3601 times |
Wed 08 October 2025 |
358.75 (-0.65%) |
366.00 |
357.75 - 366.00 |
0.304 times |
Tue 07 October 2025 |
361.10 (-0.99%) |
363.05 |
360.30 - 367.45 |
0.6915 times |
Weekly price and charts Mahindralife Strong weekly Stock price targets for Mahindralife 532313 are 385.98 and 406.68 | Weekly Target 1 | 370.17 | | Weekly Target 2 | 381.08 | | Weekly Target 3 | 390.86666666667 | | Weekly Target 4 | 401.78 | | Weekly Target 5 | 411.57 |
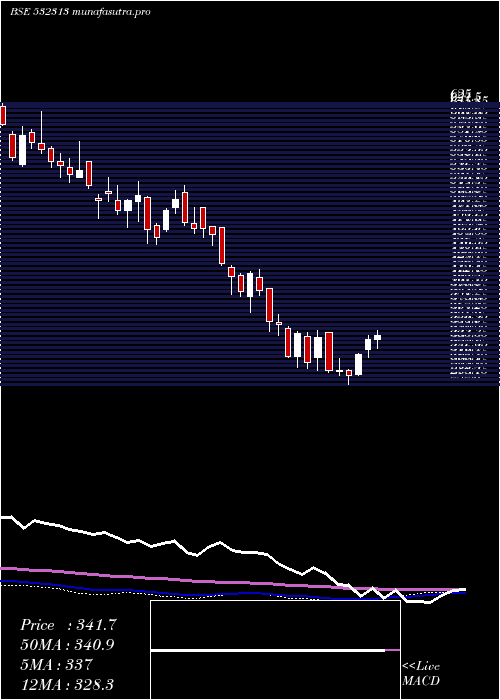
Weekly price and volumes for Mahindralife
| Date |
Closing |
Open |
Range |
Volume |
Tue 21 October 2025 |
392.00 (2.34%) |
380.00 |
379.95 - 400.65 |
0.4675 times |
Fri 17 October 2025 |
383.05 (3.61%) |
371.55 |
364.75 - 387.00 |
1.0021 times |
Fri 10 October 2025 |
369.70 (0.63%) |
367.40 |
354.75 - 373.95 |
0.6634 times |
Fri 03 October 2025 |
367.40 (2.11%) |
355.60 |
352.00 - 374.95 |
1.7703 times |
Fri 26 September 2025 |
359.80 (-5.15%) |
380.05 |
358.05 - 382.70 |
0.5966 times |
Fri 19 September 2025 |
379.35 (3.96%) |
360.30 |
360.30 - 394.00 |
2.3714 times |
Fri 12 September 2025 |
364.90 (0.39%) |
368.30 |
362.50 - 379.00 |
1.0287 times |
Fri 05 September 2025 |
363.50 (3.84%) |
350.00 |
345.10 - 364.40 |
0.8676 times |
Fri 29 August 2025 |
350.05 (1.02%) |
348.35 |
340.30 - 358.05 |
0.7289 times |
Fri 22 August 2025 |
346.50 (1.57%) |
342.90 |
338.60 - 361.10 |
0.5034 times |
Thu 14 August 2025 |
341.15 (-0.19%) |
349.75 |
337.05 - 353.95 |
0.2623 times |
Monthly price and charts Mahindralife Strong monthly Stock price targets for Mahindralife 532313 are 372.03 and 420.63 | Monthly Target 1 | 332.97 | | Monthly Target 2 | 362.48 | | Monthly Target 3 | 381.56666666667 | | Monthly Target 4 | 411.08 | | Monthly Target 5 | 430.17 |
Monthly price and volumes Mahindralife
| Date |
Closing |
Open |
Range |
Volume |
Tue 21 October 2025 |
392.00 (10.88%) |
352.05 |
352.05 - 400.65 |
0.5285 times |
Tue 30 September 2025 |
353.55 (1%) |
350.00 |
345.10 - 394.00 |
0.6955 times |
Fri 29 August 2025 |
350.05 (-5.99%) |
371.55 |
337.05 - 378.65 |
0.3186 times |
Thu 31 July 2025 |
372.35 (3.04%) |
363.00 |
347.65 - 397.40 |
0.8868 times |
Mon 30 June 2025 |
361.35 (4.03%) |
345.30 |
326.35 - 378.00 |
1.1248 times |
Fri 30 May 2025 |
347.35 (1.67%) |
343.95 |
303.60 - 370.50 |
2.0483 times |
Wed 30 April 2025 |
341.65 (14.23%) |
298.90 |
282.50 - 348.60 |
0.6514 times |
Fri 28 March 2025 |
299.10 (-5.66%) |
317.00 |
297.00 - 348.60 |
2.9498 times |
Fri 28 February 2025 |
317.05 (-24.16%) |
413.10 |
315.05 - 422.90 |
0.4191 times |
Fri 31 January 2025 |
418.05 (-9.67%) |
473.80 |
370.00 - 473.90 |
0.3771 times |
Tue 31 December 2024 |
462.80 (-6.43%) |
497.90 |
451.90 - 525.00 |
0.2361 times |

DMA SMA EMA moving averages of Mahindralife 532313
DMA (daily moving average) of Mahindralife 532313
| DMA period | DMA value | | 5 day DMA | 384.91 | | 12 day DMA | 373.19 | | 20 day DMA | 369.77 | | 35 day DMA | 369.12 | | 50 day DMA | 362.44 | | 100 day DMA | 360.73 | | 150 day DMA | 348.93 | | 200 day DMA | 361.36 | EMA (exponential moving average) of Mahindralife 532313
| EMA period | EMA current | EMA prev | EMA prev2 | | 5 day EMA | 384.28 | 380.42 | 378.15 | | 12 day EMA | 377.07 | 374.36 | 372.44 | | 20 day EMA | 373.2 | 371.22 | 369.77 | | 35 day EMA | 367.57 | 366.13 | 365.02 | | 50 day EMA | 364.35 | 363.22 | 362.33 |
SMA (simple moving average) of Mahindralife 532313
| SMA period | SMA current | SMA prev | SMA prev2 | | 5 day SMA | 384.91 | 380.11 | 378.06 | | 12 day SMA | 373.19 | 371.14 | 369.15 | | 20 day SMA | 369.77 | 368.9 | 368.62 | | 35 day SMA | 369.12 | 367.9 | 366.91 | | 50 day SMA | 362.44 | 361.54 | 360.92 | | 100 day SMA | 360.73 | 360.19 | 359.71 | | 150 day SMA | 348.93 | 348.47 | 348 | | 200 day SMA | 361.36 | 361.71 | 362.15 |
|
|
