GlenmarkPha 532296 full analysis,charts,indicators,moving averages,SMA,DMA,EMA,ADX,MACD,RSIGlenmark Pha 532296 WideScreen charts, DMA,SMA,EMA technical analysis, forecast prediction, by indicators ADX,MACD,RSI,CCI BSE stock exchange
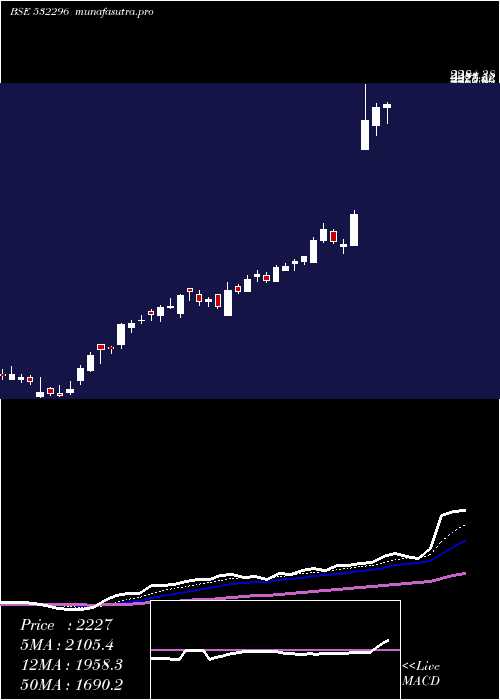
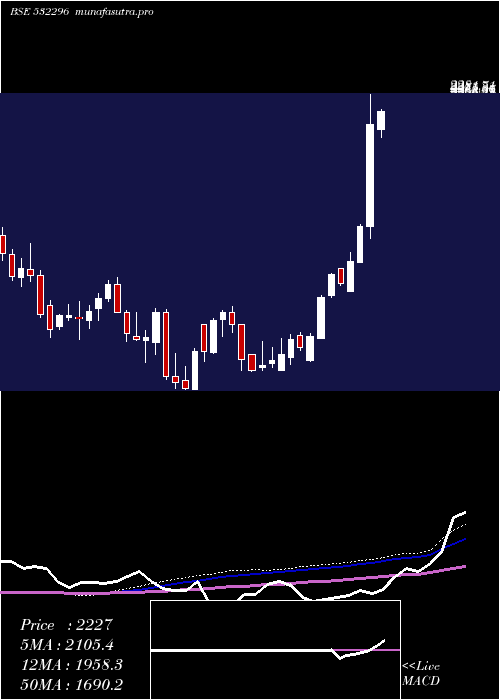
Daily price and charts and targets GlenmarkPha Strong Daily Stock price targets for GlenmarkPha 532296 are 2177.38 and 2269.83 | Daily Target 1 | 2102.13 | | Daily Target 2 | 2160.17 | | Daily Target 3 | 2194.5833333333 | | Daily Target 4 | 2252.62 | | Daily Target 5 | 2287.03 |
Daily price and volume Glenmark Pha
| Date |
Closing |
Open |
Range |
Volume |
Mon 14 July 2025 |
2218.20 (1.68%) |
2164.85 |
2136.55 - 2229.00 |
1.9277 times |
Fri 11 July 2025 |
2181.55 (14.51%) |
2095.65 |
2095.65 - 2286.15 |
6.2592 times |
Thu 10 July 2025 |
1905.15 (4.8%) |
1817.05 |
1816.45 - 1919.00 |
0.7328 times |
Wed 09 July 2025 |
1817.95 (-0.61%) |
1812.25 |
1793.50 - 1834.75 |
0.2117 times |
Tue 08 July 2025 |
1829.10 (-1.79%) |
1858.10 |
1822.45 - 1863.95 |
0.1723 times |
Mon 07 July 2025 |
1862.35 (1.68%) |
1831.70 |
1826.00 - 1879.20 |
0.3008 times |
Fri 04 July 2025 |
1831.50 (2.73%) |
1767.10 |
1767.10 - 1840.00 |
0.1434 times |
Thu 03 July 2025 |
1782.85 (0.73%) |
1770.95 |
1760.50 - 1785.00 |
0.0812 times |
Wed 02 July 2025 |
1770.00 (0.89%) |
1763.75 |
1742.05 - 1775.20 |
0.1233 times |
Tue 01 July 2025 |
1754.35 (0.07%) |
1742.05 |
1742.00 - 1764.00 |
0.0478 times |
Mon 30 June 2025 |
1753.10 (2.35%) |
1710.70 |
1710.70 - 1758.00 |
0.1351 times |
Weekly price and charts GlenmarkPha Strong weekly Stock price targets for GlenmarkPha 532296 are 2177.38 and 2269.83 | Weekly Target 1 | 2102.13 | | Weekly Target 2 | 2160.17 | | Weekly Target 3 | 2194.5833333333 | | Weekly Target 4 | 2252.62 | | Weekly Target 5 | 2287.03 |
Weekly price and volumes for Glenmark Pha
| Date |
Closing |
Open |
Range |
Volume |
Mon 14 July 2025 |
2218.20 (1.68%) |
2164.85 |
2136.55 - 2229.00 |
0.9949 times |
Fri 11 July 2025 |
2181.55 (19.11%) |
1831.70 |
1793.50 - 2286.15 |
3.9621 times |
Fri 04 July 2025 |
1831.50 (6.93%) |
1710.70 |
1710.70 - 1840.00 |
0.2739 times |
Fri 27 June 2025 |
1712.80 (4.45%) |
1612.30 |
1612.30 - 1744.35 |
0.4668 times |
Thu 19 June 2025 |
1639.85 (-1.79%) |
1690.95 |
1632.75 - 1690.95 |
0.1544 times |
Fri 13 June 2025 |
1669.70 (5.01%) |
1597.00 |
1589.80 - 1673.75 |
0.3688 times |
Fri 06 June 2025 |
1590.00 (9.07%) |
1450.50 |
1448.50 - 1597.90 |
0.8856 times |
Fri 30 May 2025 |
1457.75 (2.76%) |
1375.15 |
1372.00 - 1465.80 |
2.5541 times |
Fri 23 May 2025 |
1418.60 (-1.98%) |
1458.95 |
1410.00 - 1471.05 |
0.129 times |
Fri 16 May 2025 |
1447.30 (3.73%) |
1385.00 |
1360.00 - 1462.20 |
0.2103 times |
Fri 09 May 2025 |
1395.25 (1.42%) |
1340.35 |
1340.35 - 1451.60 |
0.2396 times |
Monthly price and charts GlenmarkPha Strong monthly Stock price targets for GlenmarkPha 532296 are 1980.1 and 2524.25 | Monthly Target 1 | 1537.97 | | Monthly Target 2 | 1878.08 | | Monthly Target 3 | 2082.1166666667 | | Monthly Target 4 | 2422.23 | | Monthly Target 5 | 2626.27 |
Monthly price and volumes Glenmark Pha
| Date |
Closing |
Open |
Range |
Volume |
Mon 14 July 2025 |
2218.20 (26.53%) |
1742.05 |
1742.00 - 2286.15 |
2.174 times |
Mon 30 June 2025 |
1753.10 (20.26%) |
1450.50 |
1448.50 - 1758.00 |
0.8194 times |
Fri 30 May 2025 |
1457.75 (5.59%) |
1352.55 |
1340.35 - 1471.05 |
1.3287 times |
Wed 30 April 2025 |
1380.55 (-10.36%) |
1540.05 |
1336.95 - 1558.50 |
1.4351 times |
Fri 28 March 2025 |
1540.05 (20.43%) |
1275.10 |
1275.10 - 1546.65 |
0.2814 times |
Fri 28 February 2025 |
1278.75 (-11.96%) |
1435.25 |
1274.70 - 1552.95 |
1.661 times |
Fri 31 January 2025 |
1452.50 (-9.72%) |
1630.95 |
1368.00 - 1658.20 |
0.3789 times |
Tue 31 December 2024 |
1608.85 (5.29%) |
1520.75 |
1447.00 - 1620.95 |
1.0443 times |
Fri 29 November 2024 |
1528.00 (-9.76%) |
1661.05 |
1451.80 - 1776.00 |
0.4953 times |
Thu 31 October 2024 |
1693.30 (1.18%) |
1673.00 |
1628.55 - 1830.05 |
0.382 times |
Mon 30 September 2024 |
1673.60 (-3.53%) |
1749.75 |
1610.60 - 1773.95 |
0.6572 times |
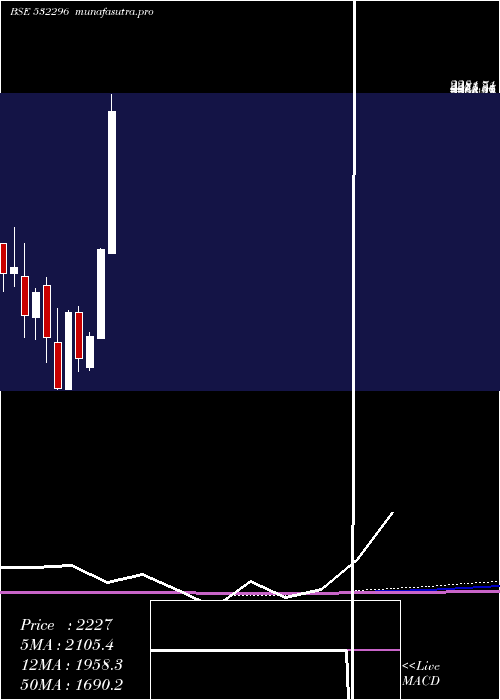
DMA SMA EMA moving averages of Glenmark Pha 532296
DMA (daily moving average) of Glenmark Pha 532296
| DMA period | DMA value | | 5 day DMA | 1990.39 | | 12 day DMA | 1868.24 | | 20 day DMA | 1793.53 | | 35 day DMA | 1678.18 | | 50 day DMA | 1601.85 | | 100 day DMA | 1504.26 | | 150 day DMA | 1511.36 | | 200 day DMA | 1550.15 | EMA (exponential moving average) of Glenmark Pha 532296
| EMA period | EMA current | EMA prev | EMA prev2 | | 5 day EMA | 2044.6 | 1957.81 | 1845.95 | | 12 day EMA | 1909.44 | 1853.32 | 1793.66 | | 20 day EMA | 1825.75 | 1784.46 | 1742.68 | | 35 day EMA | 1717.8 | 1688.34 | 1659.3 | | 50 day EMA | 1624.07 | 1599.83 | 1576.1 |
SMA (simple moving average) of Glenmark Pha 532296
| SMA period | SMA current | SMA prev | SMA prev2 | | 5 day SMA | 1990.39 | 1919.22 | 1849.21 | | 12 day SMA | 1868.24 | 1827.68 | 1788.88 | | 20 day SMA | 1793.53 | 1766.11 | 1738.92 | | 35 day SMA | 1678.18 | 1655.34 | 1633.89 | | 50 day SMA | 1601.85 | 1585 | 1568.98 | | 100 day SMA | 1504.26 | 1497.06 | 1490.18 | | 150 day SMA | 1511.36 | 1506.73 | 1502.33 | | 200 day SMA | 1550.15 | 1547.8 | 1545.53 |
|
|
